To work with large wireless networks, there are a sufficient number of good multifunctional software solutions on the market that allow you to carry out comprehensive testing of WiFi networks. However, you will often find it easier to use simpler, free tools to get a quick glimpse of the airwaves during design, deployment, or troubleshooting. We present to your attention an overview of the most interesting free programs for diagnosing WiFi networks.
In this article, we will present you nine free software tools - most of them running on Windows operating systems, others on macOS or Android - that will give you basic information about existing WiFi signals in range: SSIDs, signal strength channels used, MAC addresses and types of protection of a particular network. Some of them can detect hidden SSIDs, detect noise levels, or provide statistics on the success and failure of your wireless connection's sent and received packets. One solution includes a WiFi password cracking toolkit that will be extremely useful for finding vulnerabilities and assessing security when testing your wireless network's security against hacking.
Note also that most of the tools described below are free versions of commercial solutions distributed by the same vendor, but with reduced functionality.

Acrylic WiFi Home Wireless LAN Scanner is a stripped-down version of Tarlogic Security's commercial solution. Version 3.1, reviewed in this review article, attracts attention, primarily due to the granularity of the wireless environment and advanced graphical capabilities for displaying the collected information. The functionality of this solution includes: an overview of found WiFi networks supporting 802.11 a / b / g / n / ac standards; detection of unauthorized access points and display of connected clients; scanning and analysis of WiFi channels used by wireless networks at 2.4 GHz and 5 GHz; building graphs of the received signal level and its power for WiFi access points.
Acrylic WiFi Home WiFi scanner for Windows will allow you to scan and view available wireless networks in real time, provide information about detected WiFi networks (SSID and BSSID), their type of protection and wireless devices connected to the network at the moment, and will also allow you to get a list of WiFi passwords (set by default by manufacturers) thanks to the built-in plugin system.
As a free product, Acrylic WiFi Home 3.1 has a simple yet attractive graphical interface. A detailed list of SSIDs is located at the top of the app. Here, in particular, you can find: negative values in dBm for the received signal strength indicator (RSSI), supported by access points or WiFi-routers 802.11 standard (including 802.11ac), manufacturer name, model and MAC addresses network devices. The solution recognizes the used bandwidth and displays all the channels used for this. It does not look for hidden SSIDs, but it can show them if it finds network data that indicates the presence of hidden networks. The application also has functionality for inventorying the operation of WiFi networks, allowing you to assign and save the names of detected SSIDs and / or clients (for the free version, this feature has quantitative restrictions on use).
At the bottom of the application screen, by default, a visual rating information is shown for the network characteristics of the selected SSID. There is also a graph of the signal strength and strength of all detected access points. When you switch to the advanced mode of displaying the status of wireless networks, you will receive two additional graphs - for the 2.4 GHz and 5 GHz bands - where information about the channels used, including those combined into one "wide" channel, is simultaneously displayed signal level data.
It is extremely inconvenient to export or save the captured data, since the software company decided to cut this functionality excessively in a free solution: you can copy no more than one line of data to the clipboard and then paste the text into a text document or spreadsheet. There is also a function to post a screenshot to Twitter.
Overall, Acrylic WiFi Home is a good software WLAN scanner, especially considering that it costs nothing. It collects all the basic information about your wireless space and clearly demonstrates the obtained data, both in text and graphical form, which is perfect for simple tasks of diagnosing WiFi networks. The main disadvantage of this solution can be considered large problems with data export, or rather, the actual lack of such an opportunity in view of the functionality cut by the manufacturer itself in the free solution.
AirScout Live (Android)

Greenlee's AirScout Live app turns your Android smartphone into a handy and portable WiFi analyzer. AirScout Live has seven modes of operation, four of which are completely free to use without any restrictions for Android devices. The commercial version, unlike the free one, is compatible with most desktop computers (Windows) and mobile devices (Android and iOS). With the help of the basic functionality, you can quickly, mobile and, importantly, solve problems related to insufficient WiFi signal in some places of your office or home for free.
AirScout live will show all the characteristics of the access points detected in the range: from signal strength and security protocols to equipment capabilities. Allows you to determine the least congested channel, measure the signal strength at each point of the WiFi network and identify places with insufficient signal strength. It will help to identify sources of interference by analyzing the parameters of channel utilization in the 2.4 GHz and 5 GHz bands. Using the program, you can choose the optimal location for the location of the access points in order to provide the highest quality coverage of the premises with a WiFi network and configure it for maximum performance without buying additional equipment. In addition, the AirScout app allows you to take snapshots of the WiFi network and save locally or upload them to the cloud.
AirScout Live is very easy to use and requires no additional training. The user interface looks attractive and intuitive. The first two menu items - "AP Chart" and "AP Table" - will provide you with visual and comprehensive information about all the characteristics of the access points that are in sight. Access point coverage graphs will visually show you the dependence of the signal level of each of them and the channel load in the 2.4 GHz and 5 GHz bands. Extended tabular information about each access point (SSID, Mac address, hardware vendor, channel used, channel width, received signal level in dBm and security settings) are available in the second menu item.
The "Timeline" item will allow you to see all the access points that your Android device has detected in the observed location, and their graph of signal level changes in dBm with reference to time. So, for example, if you are exploring a network that consists of several access points, this information will help you understand what signal level each of them will be in a given location, and how the client device will switch between them. In addition, the choice of a specific access point highlights its signal strength, which helps the visual perception of information.
The "Signal Strength" item will allow you to visually test the signal strength for each access point over time. You can select a specific SSID and see the current, as well as the minimum and maximum signal strength recorded by the device for this access point. The original interpretation of the results obtained in the form of a red-yellow-green speedometer will make it possible to visually make sure whether this or that function will work in this particular place or not. For example, a stable signal strength in the green zone will tell you that here you will not have problems with such resource-intensive technologies as voice over IP or streaming video in Full HD format. Being in the yellow zone will indicate the availability of only web surfing. Well, the red zone will mean big problems with signal reception from this access point in this place.
To use additional functions that are not available in the free version of the software without additional equipment (identification of the most common problems: suboptimal signal coverage or incorrect channel selection; identification of sources of interference, including from "non-WiFi" devices; optimization of WiFi network configurations adjacent to 802.15.4 networks; tune WiFi performance by comparing signal strength and utilization; Ookla speed test and more) you need an AirScout controller or kit that includes a controller and remote clients.
AirScout Live is a great app that, above all, attracts with its mobility. Agree, having a tool that will always be at hand is worth a lot. The free version of the product provides you with all the information you need to quickly analyze the health of small office or home WiFi networks and identify underlying performance issues. The intuitive interface and competent graphic design of the obtained measurement results not only leave a good impression, but also help speed up the work with the application.

Cain & Abel is a multipurpose application for Windows operating systems for recovering and cracking passwords, which is also equipped with tools for intercepting and analyzing network traffic, including WiFi networks. Like the previous solution (Acrylic WiFi Home), Cain & Abel is a powerful network analyzer capable of capturing and processing most of the wireless network traffic.
Its graphical interface has a relatively ancient, simplistic look. The toolbar (old style with icons at the top of the screen) is used to launch various utilities. Access to the main functional parts of the application is carried out through the tabs of the windows.
Through the "Wireless" tab, we get access to functional tools for analyzing the network traffic of WiFi networks. In addition to the usual information about SSIDs and various signaling information, you can also find a list and details of connected clients here. For access points and clients, Cain & Abel provides information on the number of packets detected: all packets, WEP Initialization Vector (WEP IV) security protocol initialization vectors, and ARP requests. Any hidden SSIDs found from captured packets will be displayed in the GUI. Most of the intercepted statuses and data can be exported to a simple text file.
Despite the huge functional potential of this solution, such shortcomings as the lack of visual graphs, as well as the inability to recognize 802.11ac access points and determine wider channels, do not allow Cain & Abel to be called the best choice for monitoring and analyzing WiFi networks. This solution is worth considering if your tasks go far beyond simple traffic analysis. With it, you can recover passwords for Windows OS, launch attacks to obtain lost credentials, study VoIP data on the network, analyze packet routing, and much more. This is a really powerful toolkit for a system administrator with broad powers.

Ekahau HeatMapper is a mapping software tool for deploying small wireless networks at home and determining the optimal location for installing an AP. This is a simplified free version of professional solutions from Ekahau. This software provides the same network information as a WiFi scanner for wireless networks, but also generates a WiFi heatmap so you can visualize signal strengths. Within the framework of this review, we will focus on version 1.1.4.
The software offers the ability to create a plan or model of the object that is being investigated, as well as design a wireless network topology on a grid for approximate orientation.
The left side of the main screen of the user interface displays a list of wireless networks and their data, sorted by signal, channel, SSID, MAC address, and security type. This list includes basic information, but does not contain dBm signal level or percentage values. In addition, the application does not recognize 802.11ac-enabled networks, treating them as 802.11n.
Using Ekahau HeatMapper, as with other mapping tools, you mark your current location on a map as you walk around a building to generate a heatmap of WiFi coverage. Ekahau HeatMapper will automatically calculate the location of the hotspots and place them on the map. After all the data is collected, an interactive heatmap of WiFi coverage is generated. So, for example, when you hover the cursor over the access point icon, its coverage will be separately highlighted; and when you hover over an area of the heat map, a pop-up window will pop up a hint for the received signal level with a negative dBm value for that point.
According to reviews, the Ekahau HeatMapper software solution is an oversimplified WiFi map scanner: manufacturers have removed almost all additional functionality from the free version, making this solution a truly home version. Also, the only export or save option available is to simply take a screenshot of the map.
However, Ekahau HeatMapper can be used for small networks or to get a basic understanding of how more professional map-based tools work.

Homedale Software Utility is a relatively simple and portable (no installation required) wireless network scanner for Windows (currently version 1.75 available) and macOS (currently available version 1.03) with an optional command line interface. In addition to displaying basic information about wireless networks and signals, this utility also supports positioning using GPS and other positioning technologies.
This utility has a simple graphical interface that looks more like a multi-tabbed dialog box than a full-fledged application. The first tab "Adapters" displays a list of all network adapters, as well as their IP gateways and MAC addresses.
The Access Points tab contains a lot of important information. It does not contain information about the 802.11 standard for each SSID, but here you will find all supported data rates, as well as the numbers of all channels used by each SSID at a given time, including those with a larger channel width. There is no listing of hidden networks here either, but other network data is shown that indicate the presence of hidden SSIDs. Also a very useful feature is the ability to save notes for individual SSIDs, which can then be included in any data export.
In the Access Point Signal Graph tab, you will find the change in negative values in dBm for the received signal strength indicator over time for all selected SSIDs. Implementation of access to this functionality cannot be called very convenient and intuitive - the selection of wireless networks for monitoring and comparison is made by double-clicking on the desired SSID from the list of the previous "Access Points" tab.
The "Frequency of use" tab illustrates in real time a graphical dependence of the frequencies used by each SSID (for convenience, divided into channels) and the signal level values. The channel usage visualization is displayed for the 2.4 GHz band and each subset of the 5 GHz band. The utility performs its task - visually demonstrates the employment of each channel - but it would be more convenient if we had the opportunity to have a single idea of the 5 GHz frequency, instead of dividing it into four separate graphs.
In addition, Homedale offers an excellent free app for exporting collected data. Thus, it supports saving the network list in a tabular form in CSV format, recording the results of each scan in the log (it will be useful if you move around during the scan), as well as saving an image of each graph.
Despite its very simple graphical user interface, Homedale provides more advanced functionality than you would expect from it. In addition, I would like to note the rather impressive, both for a free program, the ability to record and export data, as well as to determine the location.

LizardSystems offers a free version of its WiFi Scanner software for non-commercial use, which has the same features and functionality as their paid product. Version 3.4 of the solution is currently available. Besides WiFi scanner, this solution also offers excellent functionality for analysis and reporting.
The application has a modern graphical interface, intuitive and easy to use. The Scanner tab contains a list of detected SSIDs. In addition to the standard detailed information, here you will also find signal level values both in negative dBm values and as a percentage. It even shows the number of clients that are connected to each SSID. Also, along with the specification of 802.11 standards, the solution can define and report multiple channels used by any SSID with a larger channel width.
You can use the list of visible SSIDs to filter the input by the following parameters: signal level, supported 802.11 standard, security types and used frequency bands. At the bottom of the Scanner tab, there are graphs that you can switch between. In addition to typical graphs showing signal strength and used channels, visualized data on data transfer rate, channel utilization and number of clients is also available. The bottom of the screen displays information about the current connection. In the "Advanced Information" tab, you will find various data about network activity, down to the number of unprocessed packets.
The Current Connection tab displays more detailed information about the current wireless connection. This is where you can access and manage the list of wireless profiles stored in Windows 10, which can be useful as this latest version of the Windows operating system no longer provides native access and management of this list. The Wireless Statistics tab provides graphs and statistics for various packet types, both physical (PHY) and link (MAC) layers, which will be useful for advanced network analysis.
LizardSystems WiFi Scanner software solution offers advanced export and reporting capabilities. Basic functionality allows you to save a list of networks in a text file. In addition, you can generate reports summarizing the types of networks found by scanning, with all registered SSIDs, any comments you add, and graph snapshots. These are pretty impressive features for a free WiFi scanner.
Thus, LizardSystems' WiFi Scanner really impresses with its functionality, including filtering and reporting capabilities, as well as advanced information about transmitted data packets. It can be an important part of your travel toolbox for maintaining and testing WiFi networks, but remember that the free license is only available for personal use.
NetSpot (Windows and macOS)

NetSpot App is a software solution for researching, analyzing and improving WiFi networks. The commercial version uses cartographic tools for thermal imaging of coverage areas, but it is not available in the free version for home use. However, this solution is offered for both Windows and macOS operating networks. As part of this review article, we will look at NetSpot Free version 2.8 - a free, significantly stripped-down version of the company's paid products for home and corporate use.
The NetSpot Discover tab is a WiFi scanner. Despite its simple graphical interface, it has a modern appearance, and the network details of each SSID are in bold and clearly visible. Signal levels are shown in negative dBm values (current, minimum and maximum), as well as in percent. Hidden networks in the free version are not displayed, as well as the ability to export data is not supported (although there is such a button, it is not active).
When you click on the "Details" button at the bottom of the application window, combined graphs of signals and channels used for each WiFi range are shown, generated for the SSIDs selected from the list. In addition, the signaling information for each SSID is displayed in a tabular format so you can see the exact values the application gets from each scan.
Overall, the free version of NetSpot does a good job of detecting WiFi networks (although it doesn't support hidden networks). And yet, the free solution has very limited functionality, which is eloquently indicated by broken links to a large number of additional features - this is the inaccessibility of visualizations, and the inability to use a heat map, and the lack of export.
WirelessNetView (Windows)

WirelessNetView is a small utility from the NirSoft web resource that runs in the background and monitors the activity of wireless networks around you. It is offered free of charge for personal and commercial purposes. This is a fairly basic WiFi scanner available in both handheld and installation configurations. Within the framework of this article, version 1.75 is considered.
WirelessNetView's graphical user interface is not very sophisticated - it's just a window listing the wireless networks. For each detected network, the following information is available: SSID, signal quality at the current time, average signal quality over the entire observation time, detection counter, authentication algorithm, information encryption algorithm, MAC address, RSSI, channel frequency, channel number, etc. ...
Thus, this utility provides indicators of the signal level in negative dBm values, as well as in percentages for the last received signal and the average for the entire observation period. But it would be even better if we also had access to the average values for the RSSI of a particular access point over the entire observation period. Another unique piece of the analytics available that WirelessNetView offers is how often each SSID is detected, which can be useful in certain situations.
Double-clicking on any of the detected wireless networks will open a dialog box with all the information about a specific network, which can be very convenient, since your screen is clearly not wide enough to view all the details in the main list. Right-clicking on any network in the list will save the data for that specific wireless network or all detected networks to text or HTML files. The Options toolbar menu displays some options and additional functionality, such as filtering, MAC address formatting, and other display preferences.
Please note that this utility lacks a number of advanced features that we would expect to see in modern WiFi scanners. First of all, we are talking about a graphical presentation of information, full support for the 802.11ac standard and, accordingly, recognition of all channels occupied by an access point, which can use a large channel width. However, WirelessNetView can still be useful for simple monitoring of wireless networks or small WiFi spaces, especially if you find some of the unique functionality of the utility to be of value.
Wireless Diagnostics (macOS)

Starting with OS X Mountain Lion v10.8.4 and later operating systems, Apple provides the Wireless Diagnostics tool. It is more than just a WiFi scanner; it can help detect and fix WiFi connection problems. Best of all, it is the native toolkit included with the operating system. For this review, we'll take a look at the Wireless Diagnostics software solution included with macOS High Sierra (version 10.13).
To get started, press the Option key and then click on the Airport / WiFi icon at the top of MacOS. You will have more information about your current WiFi connection, as well as access to the "Wireless Diagnostics" shortcut.
Opening Wireless Diagnostics will launch a wizard called “Assistant,” which may ask for additional information such as the make and model of the router and its location. Tests will then run to detect problems. Once verified, a summary of the results will be shown, and clicking the icon for each result will show extended details and suggestions.
While not entirely obvious, there are more tools available to you as well, not just the aforementioned wizard. While the wizard dialog box is open, clicking the Window button at the top of the toolbar will provide access to additional utilities.
Scan Utility is a simple WiFi scanner that shows common data about detected wireless networks, as well as a brief description of the types of networks and the best channels. One of its main advantages is that it shows noise levels in WiFi channels that most of the Windows scanners presented in this article do not. However, it would be more convenient if all channels that use specific SSIDs with a larger channel width were listed, and not just the channel width and center channel would be shown.
The Info utility shows the current network connection and detailed signal specification details. The Logs utility allows you to configure the WiFi, EAPOL and Bluetooth diagnostic protocols. The Performance utility displays line graphs of signal and noise, signal quality and data rate of the current connection. The Sniffer utility allows you to capture raw wireless packets, which can then be exported to a third-party packet sniffer.
Thus, the utilities included in the Wireless Diagnostics toolkit of the macOS family of operating systems are truly impressive, especially when compared to the native wireless toolkit for Windows operating systems. You always have a WiFi scanner (which even shows noise levels) and packet capture (exportable) at your fingertips, and their Troubleshooting Assistant seems really smart. However, for the visualization of WiFi channels, in our opinion, there is not enough channel usage graph.
In addition, Apple offers an excellent tour and guide on using Wireless Diagnostics for more information.
conclusions
Each of the programs we have considered for diagnosing WiFi networks has its own advantages and disadvantages. At the same time, all these solutions, judging by the feedback from users, are worthy of being downloaded and evaluated in action. The choice of the optimal program for each specific case will be different. So try it!
See also:
The article discusses free software (software) running Microsoft Windows, which allows for a preliminary analysis of the radio coverage of the territory for the presence of third-party equipment operating in the Wi-Fi range of 2.4 / 5 GHz. A comparison of the technical features of the considered software is made.
Introduction
In wireless networks, the communication channel between the transmitter and the receiver is open, which greatly complicates the analysis of radio signal propagation in the territory of the projected network. And even more unpleasant is the fact that neighboring wireless equipment through this "open" channel can have a negative impact on your network. Therefore, radio survey of the territory plays a very important role in the design of a Wi-Fi network. Some experts assure that the radio survey is a completely unnecessary stage, referring to the fact that the surrounding networks are also constantly appearing, developing, modernizing, being transferred, etc. But you must agree, it is better to know in advance that a giant network of points lives near you access to a neighboring office, and take appropriate measures (for example, move to other non-overlapping frequency channels), than then face the problems of radio wave interference and, as a consequence, the low bandwidth of your "open" communication channel.
Today there is a sufficient amount of software that allows you to assess the level of the surrounding electromagnetic background in the 2.4 / 5 GHz bands. This article discusses programs that run on the Windows OS.
1. Acrylic Wi-Fi
Acrylic Wi-Fi is the newest free network scanner that displays available wireless networks, their technical characteristics (protocol, channel, maximum speed, etc.) and information about their security level. The program even provides a list of Wi-Fi passwords that are used by default access points.
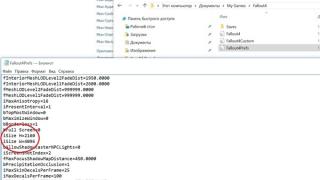
Acrylic has a paid professional version with advanced features to detect wireless security issues. Also in this version, the program performs a radio survey of the territory and offers to select the optimal channels in the network to ensure the most correct operation. The appearance of the program is shown in Figure 1:
Figure 1 - Appearance of the Acrylic Wi-Fi program
In the free version of the program, its capabilities remain rather scarce, limited to the output of the information shown in the screenshot above (Figure 1), namely: transmitted by the access point - SSID; its MAC address; RSSI - signal level; Chan - number of the channel used for transmission; 802.11x - Wi-Fi transmission standard; Max Speed - maximum speed; WEP / WPA / PWA2 - encryption type. An excellent function is that the program shows on which access points the WPS 1.0 / 2.0 mode is enabled, because it is no secret to anyone that this WPS 1.0 has long been a kind of "back door" for any network. It also displays related information about the manufacturer (Vendor) and the type of network in which the access point operates (Type), or in other words: it has access to the Internet, or there is no point in breaking it (just kidding). For more pathos, a graph is displayed showing changes in signal strength from various access points over time (bottom right in Figure 1).
In general, the listed set of functions is limited to the free version of Acrylic Wi-Fi. Quite scarce, considering that long before this program appeared software capable of more.
It's difficult to find fault with the professional version of the program, quite a lot of useful functions have been stuffed there, for example, the program itself will indicate the access points that negatively affect your network. Acrylic allows you to generate reports on the status of Wi-Fi networks with detailed characteristics of access points and transmit them to a communicator or administrator's computer.
Resume on Acrylic Wi-Fi: When working with this program, I got the feeling that it was made entirely on the Kali Linux platform, with the only difference that the graphical shell has been added to work from under Windows. The paid version is complemented by the fact that it allows you to generate reports in HTML-format and helps the user to make decisions about network configuration without going into technical nuances. Thus, I would rate the free version of the program at three points on a five-point scale, it can be classified as software for "beginners", the paid version of the program deserves a slightly higher mark of three plus (due to the generation of reports). Nevertheless, in general, the program remains weak in its technical capabilities. It also contains a bunch of distracting links leading to the developer's site and profiles on google +, Facebook, twitter, etc. That in general creates the impression not of a technical application, but of a program for entertainment, when, out of nothing to do, I decided to "monitor" the neighboring Wi-Fi access points.
2. Wi-Fi Scanner
This software can show detailed information about 802.11 a / b / g / n / ac networks near you, as well as access point parameters and signal strength. The program also has a paid and free version, unlike the previous software, they do not differ in functionality. After installing the program, you can use it for 30 days, after which you need to register it - free of charge for personal use, or buy - in the case of commercial use of the software. The appearance of the program is shown in Figure 2.

Figure 2 - Appearance of the Wi-Fi Scanner program
As in the previous software, the main column displays information about the available networks, but the information is more extensive. The presence of additional columns: Achievable rate - actually achievable data transfer rate, Channel Width - used channel width, Spatial stream - spatial streams (here we are talking about MIMO technology), Channel Utilization - how busy the data transmission channel is, and more advanced information about the used security protocols , and specifically - the type of encryption: CCMP / TKIP / WEP / or their combination.
The free version of this program has all the features listed in the professional version of Acrylic Wi-Fi. In particular: Figure 3 shows a graph of the signal strength from available Wi-Fi networks. Very user-friendly and intuitive.

Figure 3
Figure 4 provides extended information about one of the surrounding networks. In this case, this is a network of the same name Rostelecom.

Figure 4
Resume on Wi-Fi Scanner: In my opinion, the design of this program is quite "light" in terms of the perception of the displayed information, and the location of all buttons and tabs is intuitive. This program is an excellent solution for private use, and for commercial use the prices are reasonable. The program deserves an excellent mark.
3. Homedale
Belongs to the class of "weak". From a technical point of view, the program has glitches and flaws, but it works on the latest versions of Windows. The program is easy to use, but only allows you to estimate the signal level coming from the access point, and some information already listed in previous software products. The program does not see the hardware manufacturers and does not always determine the model of the access point whose network it has detected. Moreover, the signal strength from the access point is also not always able to determine. The appearance of the main window of the program is shown in Figure 5.

Figure 5
The program does not provide filters in any way, therefore, for example, on the graph of the power distribution of available access points by channels, it is impossible to remove the "uninteresting" connections for us, so there is just such an uninformative stuffing shown there (Figure 6):

Figure 6
Given the incomplete performance of this program, it is assessed, to put it mildly, "unsatisfactory." The program is rather weak in comparison with other similar free software, widespread across the Internet.
4. Outdated monitoring programs
The list of obsolete programs includes those that either do not support the "modern" Wi-Fi standards - IEEE 802.11n / ac, or no longer work under Windows 7/8 / 8.1 / 10. And the appearance of these programs is rather depressing, which is not pleasing to the eye.
Network Stumbler is a lightweight Windows wireless monitoring tool. Its development stopped at supporting the 802.11 a / b / g standards, that is, it monitors the network only in the 2.4 range, excluding the five gigahertz one. The software works on Microsoft Windows systems up to and including XP.
WirelessNetView was once an excellent tool for monitoring Wi-Fi networks, but is now somewhat outdated.
Wireless Network Watcher - originally designed to detect and analyze Wi-Fi networks. I myself once used it, the utility scanned local networks, including wireless ones. The program displays a list of all devices currently connected to the scanned network. The device information display table contains information such as: IP, MAC address, device name and adapter manufacturer. The list can be exported to HTML. On the issue of analyzing Wi-Fi networks, her attitude is rather mediocre, because in order to get information about a Wi-Fi network, you need to connect to it. In fact, she got into this review simply because of her specific name.
Instead of a conclusion
The above programs Acrylic Wi-Fi and Wi-Fi Scanner belong to the class of those free programs that keep up with the times and are able to monitor access points running on the relatively recently appeared IEEE 802.11ac. In addition to the programs reviewed, there are also no less famous ones that have not been included in this review, among which inSSIDer is a completely and completely paid software recently. In addition, a large number of programs are available on the network running Os Android, Mac Os and Linux. But that is another story.
Wi-Fi, short for Wireless Fidelity, is one of the most widely used wireless standards in the world today. Mobile Internet has not yet received widespread development due to limited technical capabilities and high cost. But there are different kinds of routers in every apartment and in almost any office. Moreover, Wi-Fi zones are appearing in more and more parks, squares, and public transport. High-speed free access is one way to lure people into a cafe or supermarket.
It is not surprising that special applications are gaining popularity that allow you to find available networks and show their characteristics. Such programs are called scanners or analyzers. Before considering what a Wi-Fi scanner is and how to use it, let's clarify what characteristics a network basically has and what useful information you can learn about it.
Wi-Fi network settings
Below are the main parameters of wireless networks that characterize their quality and availability:
- Standard - affects speed, quality and encryption. The following standards exist:
- 11b - the very first and practically not used now, with a low level of security, an unreliable type of WEP encryption, a low speed of up to 11 Mbps.
- 11g - more advanced, the speed reaches 54 Mbps, supports the WPA2 security protocol.
- 11i is even more modern, supporting WPA2 encryption, at a speed of 125 Mbps.
- 11n - relevant today, provides a higher bandwidth, coverage area, speed of 300 Mbps.
- Various types of security:
- WEP is an unreliable option, since part of the key is dynamic and changes periodically, and it repeats at certain intervals, which makes it available for cracking.
- WPA - works on the same algorithm, but with a more frequently changing key and protocol for checking packet integrity.
- WPA2 is an enhancement to WPA with a stronger encryption algorithm.
- 1X is a multi-protocol security standard used in corporate networks.
- VPN - virtual private network, provides almost 100% security, is also used for corporate networks.
- Channel - the frequency range in which the router operates. There are 13 2.4 GHz frequency channels in Russia, of which 3 do not overlap (1, 6 and 11). Some of the more expensive routers operate at 5 GHz, where there are more non-overlapping channels.
The Wi-Fi scanner is designed to collect information on the above indicators, as well as data on the network name (SSID), MAC address, signal strength.
Scanning networks in Windows
Analyzers designed for Windows networks are the most functional and provide detailed information. In addition, they sometimes allow you to change settings where possible.
Where can such a scanner come in handy? If you need access to the network, then with the help of it you can quickly analyze those in the access zone and not protected by a password. The application is also used to increase the connection speed, since it allows you to analyze the congestion of channels and switch the router to a less loaded one, where there is less interference.
Popular programs for Windows are:


- Download the program from the manufacturer's website (it provides a free trial) and install it on your computer.
- A list of networks and their parameters is displayed in the upper part of the program window.
- Below there are four tabs: a welcome tab with ads, TimeGraph - shows the signal graph, then 2 tabs with a frequency of 2.4 GHz and 5 GHz. They show graphs of channel usage at these frequencies.
- Look at the most loaded channels: those on which a large number of routers intersect - and rebuild yours to a freer one. Moreover, if there are channels that are equally loaded, but on one of them the routers have a weak signal, then it is better to choose it. There will be less interference and better speed.
Thus, with the help of specially created software, it is possible to find free Wi-Fi networks and improve the speed of your router by switching to a less congested channel. The standard Windows utility does not have such capabilities. Autoselection is often set in the router's settings, but it doesn't always work well. Such scanners exist for Android and iOS mobile devices, they can be downloaded from PlayMarket and AppStore. They have less capabilities, but nevertheless provide the necessary information.
Sometimes in everyday life, when using Wi-Fi networks, the most stable access point, which shows the best coverage, does not give the most stable Internet. To easily identify wi-fi access points that give out a stable Internet, without any kind of interference, you need a wi-fi analyzer, which will be discussed in this article.
What is wifi analyzer
Wifi analyzer- a program or device that performs scanning, network analysis; as if the captain of the Evidence tells us. The goals and implementation of such an analysis can be very different from finding a cleaner channel to Aircrack-ng methods, which is highly desirable to take into account when looking for a wifi scanner. Nevertheless, speaking of the analyzer, they mean a tool for building a coverage map, analyzing channel distribution, analyzing interference and signal level, excluding traffic analysis tools like Wireshark, Aircrack, tcpdump, they are still a little bit different, although they can also analyze interference if ask.
To put it quite simply, a wifi analyzer is a program to see why Wi-Fi does not "go".
 This class of instruments is needed to observe the mutual influence of centimeter range radio devices, which is any equipment that can wi-fi, or in simple terms, in order to see in realtime not only who is to blame, but also what to do, to restore a stable connection in the sense of where and how to cut down, yeah, a kind of tractor Peter's pig.
Wi-fi analysis is a common and necessary task when setting up, diagnosing, restoring and hacking a network. Naturally, depending on the task, the aspects of the analysis are different, if the physical properties of the channel (frequency, influence of fields, channel occupancy) are more interesting during configuration and diagnostics, then during hacking, more attention is paid to logic (protection, encryption, etc.).
The task is so important that for devices such as Ubiquiti NanoStation, the implementation of the possibility of such an analysis is not a feature, but a necessity.
Yes, and endure on your favorite tablet, tearing one megabit, when you can take a couple of steps around the room to five stripes ... in order to know where to step, analysis is needed.
The stability of the connection depends on many factors that are difficult to calculate: the mutual arrangement of devices, the effect of close frequencies, and even the state of the surface. All this is practically impossible to calculate, but you can view it in real time and select the frequency and position in which there is a minimum of negative influence. Since its speed depends on the stability of the connection.
WiFi analyzers
There are countless software implementations of analyzers. Both well-known software writers and specialized offices were noted here, some of which, in general, are hardware manufacturers like the aforementioned Ubiquiti with their AirView. All programs differ slightly in interface and visualization method, they do about the same and even the same.
Some differences are dictated by the purpose of scanning, for example, TamoGraph Site Survey is focused on placing WiFi devices by area; InSSIDer - to analyze the connection of available networks in the allowed ranges; and AirView exists to make life easier for the Ubiquiti tuner in and out of range. Nevertheless, the most widely heard of the entire family is the Wi-Fi analyzer, presented by utilities for android and Windows devices, because "I am an android, I need the Internet and an outlet." The program allows you to find a place where no one and nothing interferes, simply mastered and used, while sufficient for home use.
An example of a wi-fi network analysis
Any Analysis is meaningless without a goal. This is such an abstract thought. The purpose of the first example will be to restore the channel width between Vasya and Petya. The channel is tuned on Ubiquiti equipment and has only two antennas for simplicity. Having detected a drop in speed, Vasya enters 192.168.1.20 and sees there, say "transmit ccq 50%". Swearing at the slow connection, Vasya rocks JAWA and finally he presses the big blue Launch AirView button. From this moment, the analysis actually begins, which, by the way, needs to be allowed to work for 10 minutes to accumulate statistics.

Most analyzers display information in the form of graphs, there are many of them, but usually they duplicate each other in one way or another. Vasya has three of them - short-term (power) displays changes in the last minutes of work, long-term (power) displays a scale from the moment the scan was started, and long-term (energy).
Having recalculated the peaks on the “Waveform View” graph (long-term graph of power changes), Vasya not only sees that some device has appeared nearby in frequency, but also detects by the depth of blue color to which frequencies the channel can be changed.
The second task for the example will be the task of finding a wider channel for the android. We launch the Wi-Fi analyzer, look at the channel rating for a point on the “channel rating” tab, get the numbers of free channels. Somehow an example did not come out. Take, for example, the problem of finding a stronger signal for a point. We launch the Wi-Fi analyzer, turn on the meter and see how the readings change when we walk around the room, by the way, if we bind the device data to coordinates in the process, we will get a coverage map.
Wifi analyzer for android
A portable device used in a complex radio environment must have a means of analyzing the surrounding chaos, it is simply obligatory. Typing Wifi analyzer, we get a list of positions by 10, similar functionality and implementation, well, as I said, it's a good place.
Having chosen a program that is convenient for yourself, sometimes you do not understand how you lived before its installation. Evaluate the network, find the optimal location, and due to the size of the wifi wave, the connection depends on the position and orientation of the device. Yes, in the end, the choice of a connection point from among the possible is also an analysis, wired into the carrier of the phone.
Wifi analyzer for Windows
All reflections on a portable device are still valid, only there is less choice in the store, the prices are higher, although there is a Wi-Fi analyzer and is even free. InSSIDer and many, many others are found on the Internet. The TamoGraph Site Survey mentioned above is also from this sandbox.
Having a Wi-Fi on board, you must also have its analyzer. Aksakals say that even after removing it for the sake of free space, it still has to be installed over and over again.
Do not put your hopes on, this is just a utility for "looking with your eyes", having seen and corrected the channel frequency, the position of the device and the antenna, you can have a more stable contact at a higher torrent speed, especially if you move the welder away from the antenna.
3 more useful articles:
WiFi Guard is an absolutely essential utility for all enthusiasts with a small wireless network who want to secure it. ...
WiFi Crack is a program for forgetful users or novice crackers. Allows easy and simple brute-force ...
And start NetSpot. By default, the program will open in the Search Mode, which will help you monitor the surrounding wireless networks in real time. Please note - NetSpot remembers the active mode before exiting the program - search mode or polling mode.
Step 2
Search and scan mode
In search mode, in a few seconds you will receive the first data on the surrounding wireless networks. And the longer NetSpot runs in search mode, the more accurate and complete the data will be.
Step 3All found Wi-Fi networks are clearly visible
Search Mode in NetSpot 2.x is a separate interactive list with information about all non-hidden wireless networks. The list is updated depending on the interval you set, every 5-10-30 seconds. If any network disappears, you can still see it for a while and determine how long ago it disappeared.
Step 4Scanning Wi-Fi networks
To stop scanning, just click on the "Pause" button in the lower left part of the program window. Scanning will be paused until you start it again. If there are too many found wireless networks displayed, you can filter them by any parameter or simply exclude them from the general list.

Step 5
Multifunctional scanning of radio space
In the NetSpot Search Mode, you can configure the list of displaying the parameters of interest for the found networks; this list is configured by right clicking on the table header. Typically, users are interested in signal strength, network name, network signal-to-noise ratio, BSSID, channel, mode, security, etc. You can also customize the order in which the parameters are displayed: just press and hold the parameter of interest in the table header and move it left / right, depending on its priority.

Step 6
Visualization and export
NetSpot provides the ability to visualize and export the received data. To visualize the data, click in the lower left part of the "Details" window, where you can see a graph built in real time and analyze the received data of the network of interest. To export the received data to CSV, click "Export" on the main toolbar.