IDEF0 diagrams are built using the BPWin program. They are intended for graphical modeling of ongoing business processes.
About the IDEF0 methodology
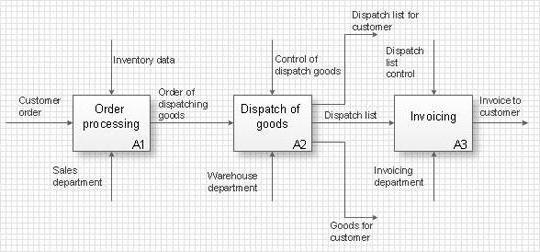
The IDEF0 methodology is widely used due to its simple and easy-to-understand graphical notation, the use of which is very convenient for building a model. The main place in the methodology is given to diagrams. The diagrams display the functions of the system using geometric rectangles, as well as the existing connections between the functions and the external environment. Links are displayed with arrows. You can verify this by seeing what the IDEF0 diagram suggests, examples of which can be found in this article.
The fact that only two graphical primitives are used in the simulation makes it possible to quickly explain the current IDEF0 interaction rules to people who have no idea about it. Through the IDEF0 diagrams, the customer's connection to ongoing processes is carried out more quickly through the use of a visual graphic language. You can see what the IDEF0 diagram suggests, examples of which are shown below.

Elements used for IDEF0
As already mentioned, 2 types of geometric primitives are used: rectangles and arrows. Rectangles denote certain processes, functions, activities or tasks that have goals and lead to a designated result. The interaction of processes between themselves and the environment is indicated by arrows. IDEF0 distinguishes between 5 different types of arrows.
Possibilities of using IDEF0
The IDEF0 methodology can be applied to describe the functional aspect of any information system.

Types of links between IDEF0 processes
It is in the interests of the model to create such links of constructions so that the internal links are as strong as possible, and the external ones are as weak as possible. This is the strength of modeling with IDEF0. You can see examples of diagrams for yourself and verify the veracity of these words. To facilitate the establishment of links, similar ones are combined into modules. External links are established between modules, and internal links are established within modules. There are several types of connections.
1. Hierarchical ("part" - "whole") connection.
2. Manager (regulatory, subordinate):
2) feedback control.
3. Functional or technological:
2) reverse input.
3) consumer;
4) logical;
5) methodical or collegial;
6) resource;
7) informational;
8) temporary;
9) random.
Building blocks and links in diagrams
The IDEF0 methodology provides a number of rules and guidelines for its use and for improving the quality of use. So, the diagram displays one block, on which you can set the name of the system, its purpose. 2-5 arrows lead to the block or from the block. It can be more or less, but at least two arrows are needed for entry / exit, and the rest for additional work and their indication on the diagram. If there are more than 5 arrows, you should think about the optimality of building a model, and whether it is possible to make it even more detailed.

Building Blocks in Decomposition Diagrams
The number of blocks that will be on one diagram is recommended in the amount of 3-6. If there are fewer of them, then such diagrams are unlikely to carry a semantic load. If the number of blocks is huge, then it will be very difficult to read such a diagram, given the presence of additional arrows. To improve the perception of information, it is recommended to place blocks from top to bottom and from left to right. This arrangement will reflect the logic of the execution of the sequence of processes. And also the arrows will create less confusion, having a minimum number of intersections with each other.
If the launch of a certain function is not controlled in any way, and the process can be launched at an arbitrary moment, then this situation is indicated by the absence of arrows indicating control and entry. But the presence of such a situation can tell potential partners about a certain instability and the need to take a closer look at a potential partner.
A block that has only an entry arrow indicates that the process is receiving input parameters, but control and adjustment at runtime do not occur. A block that has only a control arrow is used to designate jobs that are called only by special order of the control system. They are managed and corrected at all their stages.
But the IDEF0 charting example can convince you that the most complete and inclusive type is the entry and control arrow diagram.
naming
To improve visual perception, each block and each arrow should have its own name, which will allow them to be identified among many other blocks and arrows. This is what diagram examples look like in IDEF0. The information system built with the help of them will allow you to understand all the shortcomings and complexities of the models.
Merging arrows is often used, and there are questions about their naming. However, merging is possible only if homogeneous data is transferred, so separate names are not needed, although they can be specified in the BPWin program. Also, if the arrows diverge, then they can be separately named in order to understand what is responsible for what.
If there is no name after the branch, then the name is considered exactly the same as it was before the branch. This may be the case if two blocks require the same information. The IDEF0 context diagram, an example of which can be found in this article, confirms these words.

Arrow Information
Arrows entering and leaving the same block when building a composition diagram must be displayed on it. The names of geometric shapes transferred to the diagram must exactly repeat the information of the highest level. If two arrows are parallel with respect to the arcs of the other (i.e., they start on the edge of one process and both end on the same edge of another process), then it is possible that in order to optimize the model they should be combined and a suitable name should be chosen, which is beautifully displayed in IDEF0 (example diagrams in Visio can be viewed).
An example of the implementation of the IDEF0 methodology on a specific model
You have already learned what an IDEF0 diagram is, you have partially seen examples and rules for constructing such diagrams. Now we should turn to practice. For a better understanding, the explanation will not be based on some “general” model, but on a specific example, which will allow you to better and more fully understand the features of working with IDEF0 in the BPWin program.
As an example, the speed of a train from point A to point B will be taken into account. It must be taken into account that the train cannot develop a speed greater than that taken as permissible. This limit is established on the basis of operating experience and the influence of trains on the track. It should be understood that the purpose of the train is to deliver passengers who, in turn, have paid in order to safely and comfortably reach their destination. An IDEF0 diagram is useful, examples of which can be found in this article.

The initial information is:
- data about the track line;
- passport of the entire distance;
- path plan.
Control data:
- Indication of the chief, head of the track service.
- Information about the existing flow of movement of trains.
- Information about planned repairs, reconstructions and track changes.
The output of the model is:
- Restriction of permissible speeds indicating the reason for the restriction.
- Permissible speeds when driving at separate points and during the haul of trains.
When a context diagram is built, it must be drilled down and then a composite diagram created, which will be the first level diagram. It will show all the main functions of the system. The methodology and IDEF0 diagram for which the decomposition is done is called the parent. An IDEF0 decomposition is called a child decomposition.
Conclusion
After decomposition at the first level, decomposition of the second level is carried out - and so on until further decomposition loses its meaning. All this is done to obtain the most detailed graphic scheme of ongoing and planned processes. This is a ready-made example of an IDEF0 diagram that you can navigate right now.
- Functional modeling of an information system using CASE-technology IDEF.
- Description of the logic of interaction and the sequence of work.
2. Lesson plan
- Knowledge control by testing (test ISE002).
- Development of a multi-level model of information system activity (AS - IS model) using the BPwin CASE tool using technologies IDEF 0 And IDEF 3
:
- Description of the model properties (Model Properties).
- Creation of the FIRST level of a functional model - development of a context diagram.
- Creation of the SECOND level of the functional model - carrying out the detailing of the contextual work and the development of the decomposition diagram.
- Creation of the THIRD level of the functional model - detailing the work of the second level that implements the function Activity accounting organizations. The implementation of this development stage allows the creation of a decomposition diagram using one of two methodologies - IDEF 0 (1st option) or IDEF 3 (2nd option). According to the 2nd option, the creation of a scenario and a sequence diagram for the execution of individual works (workflow diagram) in the process of accounting for activities is carried out using the IDEF 3 methodology.
- Development of a dictionary of works and a dictionary of arrows, which allow you to display a description of the corresponding fragments of the model.
- Functional modeling of an information system using technology IDEF must be carried out using the CASE tool BPwin, which is loaded by the command Start/Programs/Computer Associates/BPwin 4.0/BPwin4.0 . Technological processes of IDEF-modeling are described in section 4 "Theoretical information for a practical lesson".
- When developing a context diagram, it should be borne in mind that the properties of the model can be arranged as follows, using information corresponding to the modeled subject area:
- Model Name : Activities of the firm "Name";
- Project (project name): The model of the firm "Name";
- Full name, group;
- Scope (modeling area, including the purpose of modeling, i.e. questions that the built model should answer) - for example, "General business management of the company: market research, purchase of components, testing and sale of products" or "Technological, financial and managerial aspects of the company's activities";
- Time Frame (model type) : AS-IS;
- definition (definition , model assignment) : Training model describing the activities of the company "Imya";
- Viewpoint (point of view – person whose point of view is adopted during development) : Head of the enterprise and general manager;
- Status : WORKING;
- Purpose (target) : Model the current business processes of the company "Imya" in order to regulate its activities;
- Source (a source information): Analysis of the subject area and analysis of input documents;
- Author Name : FULL NAME.
- While doing context diagram decomposition It should be taken into account that, being second level decomposition of the system model, is subprocess or child job , implemented in the form contextual work, which in this case acts as parenting work, implemented in the form parent diagram (Parent Diagram) . The decomposition diagram of the second level must contain at least three functional blocks, one of which must perform the modeling function accounting organization, and the rest should perform the function of modeling business processes implemented in the system.
- At each decomposition step, you should monitor the process of automatic movement of interface arcs (arrows) to the lower levels of the model and try to prevent the creation of tunneled arrows unnecessarily. If they appear, the tunnels should be removed.
- When implementing third level decomposition, it should be taken into account that each of the developed decomposition diagrams is the third level of decomposition of works of the second level and represents subprocess or child work, implemented in the form child diagram (Child Diagram) corresponding work of the third level. All works of the second level in this case act as parenting work, implemented in the form parent charts(Parent Diagrams).
- The decomposition of the work of the second level, modeling the accounting function, and the creation of a scenario for the interaction of works should be performed using the technology IDEF3, which uses as function blocks unitswork (Unit of Work, UOW) , as well as the necessary reference objects (Referents) , which can be either introduced into the script from the dictionary of arrows, or created anew.
- A dictionary of jobs and a dictionary of arrows are created at each level of model decomposition, and a necessary condition for their development is the presence of a job description. (activity) and descriptions of the data recorded on the interface arc ( arrow) .
- Save the results of the work in a file Function_Model IS_Name_ IDEF.bp1 in your folder ISE.
- An example of a generalized functional model is given in
4. Theoretical information for a practical lesson
4.1. IDEF 0-technology
The IDEF0 methodology is designed to model the activities of an organization. At the initial stage of project development, a model is created to describe the existing business processes and technological processes in the enterprise according to the “AS - IS” (“As is”) principle, and, importantly, it represents the enterprise from the perspective of employees who work on it and thoroughly know all the nuances, including informal ones. AS-IS is “what we are doing today”, before jumping to “what we will be doing tomorrow”.
Activity Model or, in other words, functional model. functional model treats the system as a set action, in which each action transforms some an object or set of objects . Technology IDEF 0 uses the principle functional decomposition systems (partitioning the system into fragments). Decomposition principle means that the functional model should be built according to the rule "top down" , from general model type to private models. Therefore, usually a functional model for solving a problem is a set private functional models .
Functional models highlight activities through representation as a special element − block. Block – the main structural element of the functional model, the graphical representation of which is diagram . Action name – verbal noun or verb . As a result of model decomposition, a set of hierarchically ordered and interconnected diagrams is created. Each diagram is a unit of system description and is located on a separate sheet.
Methodology IDEF 0 is based on four basic concepts: functional block (node), interface arc, decomposition, glossary.
Function block
The fundamental concept of technology IDEF 0 is the concept function block. It is meant to represent a certain kind activities (Activity) , which is some specific function within the considered system. This function, in turn, means some action (a set of actions), having a fixed goal and leading to some end result.
Function block is represented by a rectangle whose sides have the following values:
- The top side is control.
- The underside is the mechanism.
- The right side is the exit.
- The left side is the entrance.
The function block has a name that is specified in the verbal mood or as a verbal noun. Interaction between action and the world around it, including those with other actions, is displayed using interface arcs (arrows).
Interface arc
Interface arc displays the element of the system, which or processed function block, or have a different effect to the activity (function) displayed by this functional block. Interface arc depicted as an arrow, which indicates carrier A tool that transfers data or objects from one activity to another. The arrows describe the interaction of works with the outside world and among themselves, they represent some information and are called nouns .
The name of the arrow specifies it role (the set of possible roles is denoted by - ICOM ):
Function block input - I nput .
Management - C control .
Function block output - O output .
Mechanism - M echanism .
Input) is the material or information that is used or transformed by the work to obtain a result (output). There may not be an entry arrow.
Control– rules, policies, procedures or standards that govern the work. It affects the work, but is not transformed by the work. The arrow is drawn as entering the top face of the job. Each function block must have at least one control arrow.
It is often difficult to determine whether data is input or control. If the data in the work is changed or processed, then this is most likely an input, and if not, control. If it is difficult to determine the status of an arrow, it is recommended to draw a control arrow.
Output The material or information that is produced by the job. At least one exit arrow coming from the right side of the work is required.
Execution mechanism (Mechanism)– resources that perform work (for example, personnel, machines, devices, etc.). The arrow is drawn as entering the bottom face of the job. Mechanism hands may not be displayed. In general, the functional block is shown in Fig. 2.1.
On fig. 2.1 all interface arcs are shown as named arrows. According to the requirements of the standard, each functional block must have at least one output and one control, since each task (process) must have at least one output and at least one rule for its solution. The interface arc "Mechanism" may not be displayed.
From several functional blocks connected by interface arcs in the required way, a functional model.
Note that the arrows can branch out to make the required connections of the functional blocks.
entrance functional block can be not only output another functional block, but also its control or even mechanism. As a result, in the functional model there can be various, rather complex and unusual processes for solving problems in the information system.
Creating diagrams in IDEF0 technology
Three types of diagrams should be used when developing an organization's activity model:
- Diagram Type I – Context Diagram (there can be only one) - the top of the tree structure, which is the most abstract level of describing the system and its interaction with the external environment. It defines context function;
- II chart type - Decomposition chart .
Decomposition diagrams are designed to detail the work and contain related work, i.e. child works that have a common parental work. The lower level works are the same as the upper level works, but in more detail. Diagrams are created by an analyst in order to conduct an examination session, that is, to discuss the diagram with a subject matter specialist.
After each decomposition session, examination sessions are held - subject matter experts indicate the correspondence of real business processes to the created diagrams. Found inconsistencies are corrected, and only after passing the examination without remarks you can proceed to the next decomposition session. This ensures that the model matches real business processes at any and every level of the model.
It is necessary to set the number of works to no more than six (3-6), otherwise the diagram is poorly readable (oversaturated). The upper limit (six) forces the designer to use hierarchies when describing complex subjects, and the lower limit (three) ensures that the corresponding diagram has enough detail to justify its creation.
In the decomposition diagram, at the top left, is the work that is most important and done first. Works that are less important or performed later go down sequentially.
- Diagram Type III – Node Tree Diagram shows the hierarchical dependence of jobs, but not the relationship between jobs (there can be any number of these diagrams, since the tree can be built to any depth and not necessarily from the root).
4.2. Technological process IDEF0-simulation:

Rice. 2.2
The BPWin CASE tool has a simple and intuitive user interface for building the required functional models and scenarios. It depends on the technology used. On fig. 2.2 shows the BPWin window ( Computer Associates BPWin ).
Main window toolbar Computer Associates BPwin contains the following buttons:
– creation of a new model, |
|
– opening an existing model, |
|
– saving the built model, |
|
– printing of the model, |
|
- scale selection |
|
- scaling, |
|
- spell check, |
|
– enable/disable the model navigator, |
|
– Turn on/off the Model Mart. |
The model navigator shows the composition of the model by development level. With it, you can easily and quickly move from level to level. Working with the model navigator is similar to working with Windows Explorer.
The special toolbar contains the following main buttons:
The model window is the place to create a functional model of the system under study. Functional blocks are built and edited in it, arrows are drawn and edited, and decomposition is carried out.
Model preparation
- Click the create model button to open the dialog box BPWin(Fig. 2.3):
In the dialog box BPWin perform the following actions:
- select Business Process (IDEF0);
- set the model name and click the button OK;
- in the window Properties for New Model fix the name of the author of the model;
- press the button OK .

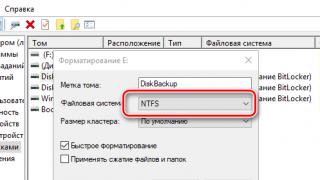
- team Model/Model Properties bring up a dialog box Model Properties (Fig. 4), in which to arrange the properties of the model in accordance with the methodological recommendations outlined in section 2.

First level of modeling
- Decorate the functional block in the model window by doing the following:
- in the context menu of the function block, select the command Name… ;
- in the dialog box Activity Properties (Fig. 2.5) in the tab Name ask name work (short) placed in this function block, and in the tab Definition in field Definition description work;
- bookmark Font set font Arial Cyr and set the checkboxes to use this font in all function blocks of the diagram ( All activities in this diagram, All activities in this model And Change all occurrences of this font in the model ), then press the button OK.
- in the dialog box Arrow Properties (Fig. 2.7), in the tab Name set the name of the arrow (short), and in the tab Definition in field Definition enter a sufficiently detailed description destination of this arrow;
|
|


- in the context menu of the arrow, select the command Font… ;
- in the dialog box Arrow Properties (Fig. 2.8), in the tab Font set font Arial Cyr and check the boxes to use this font for all chart arrows ( All Arrows in this diagram, All Arrows in this model, All instances of this Arrow And Change all occurrences of this font in the model );

- Arrow Arrow Output, left borders right;
- Arrow Arrow Control , for which repeat step 2, replacing left borders top;
- Arrow Arrow Mechanism, why repeat step 2, replacing left borders lower.
Second level of modeling
Any level of modeling
To create a model decomposition at any modeling level, follow these steps:
- click to activate a specific function block;
- repeat step 3 for the current level of the model.
- The type and style of the arrow design can be selected in the Arrow Properties dialog box (Fig. 2.9), called by the Style command from the arrow's context menu.

- For installation word wrap after highlighting the name, reduce the size of the rectangle, after which it will automatically increase downwards.
- Every arrow drawn on a higher-level diagram must be present on a lower-level diagram.
- The new arrow drawn on the low-level diagram (unresolved ( unresolved) arrow) is placed in square brackets (tunnels), which emphasize the absence of such an arrow at a higher level. To remove tunnels:
- select menu item Arrow Tunnel ;
- in the dialog box Border Arrow Editor(Boundary Arrow Editor) select option Resolve it to Border Arrow (Allow as border arrow). As a result, the tunnel at the current level will be removed, and the arrow will appear at the previous level, and if it is not the first one, then it is tunneled (Fig. 2.10).

- To copy tunneled arrows from the lower level to the upper one:
- right-click on square brackets;
- select menu item Off Page Reference;
- in the dialog box Off_Page Arrow Reference select the diagram on which the arrow should be placed and set the required arrow type switch (Fig. 2.11);

- press one of the buttons: OK and Go To Diagram (go to selected chart) or OK and Remain In Current Diagram (stay in current chart).
- run command Model/Model Properties;
- in the window Model Properties(Fig. 2.12) select a bookmark layout ;
- checkbox (option) Automatically space arrows in a group Arrows

- When creating an arrow management feedback set the option to indicate the direction of the arrow Extra Arrowhead (from the context menu).
- If the labels on the arrows are located unsuccessfully (very far, etc.), you should select the Squiggle checkbox (in the context menu) to place the label.
- In the decomposition diagram, at the top left, there is a functional block that contains the most important and performed work first. Works that are less important or performed later go down sequentially.
- Word wrap inside the work is carried out in the mode name editor… by pressing a key Enter.
- The diagonal in the upper left corner of the rectangle means that the corresponding work is not decomposed.
- To show not only the numbers of child jobs that appear automatically, but also the prefixes (A), you should select the command Model/Model Properties, bookmark numbering, checkbox (option) Show prefix(Fig. 2.13).

- To show job numbers and level numbers (two-, three-, four-digit numbers) for child jobs, select the command Model/Model Properties, bookmark numbering, checkbox (option) Use diagram numbering format (Fig. 2.13).
- In order to distinguish between different versions of the same diagram, the individual versions should be assigned numbers (C - number) arbitrarily set in the menu Diagram Properties on the bookmark kit.
Building the model tree
- team Diagram/Add/Node Tree bring up a dialog box Node Tree Wizard_Step 1 of 2 (Fig. 2.14);
- conduct a dialogue by selecting the required number of node tree levels ( Number of levels );
- press the button Ready.

4.3. IDEF3 technology
Technology IDEF3 is a process description methodology that considers execution sequence And cause and effect relationships between situations and events. Using IDEF3, they describe the logic of work execution, the sequence of their start and completion.
IDEF3 technology uses the category scenarios to simplify the structure of descriptions of a complex multi-stage process. Scenario (Scenario) – it is a recurring sequence of situations or actions that describe a typical class of problems present in an organization or system, and also a description of the sequence of object properties within the process under consideration. IDEF0 models are related to IDEF3 scripts because each IDEF0 model can be represented as one or more IDEF3 scripts.
IDEF3 technology is designed to provide process data collection and allows you to:
- document the available data on the technology of the process, identified, say, in the course of a survey of experts in the subject area;
- analyze existing processes and develop new ones;
- model situations by identifying situations in which decision-making , affecting the life cycle of the process, for example, a change in the design, technological or operational properties of the final product;
- to promote the adoption of optimal decisions in the reorganization of the process.
Scenario in IDEF3 technology
Scenario Diagrams describe actions and events that must be processed within a given period of time. The scenario is accompanied by a description of the processes and can be used to document each function of the system. Therefore, scenarios are part of the system analysis, as they make it possible to analyze the situation in time and describe the objects participating in one process at the same time.
When using IDEF3 technology, all constructions are based on two types of diagrams:
- Diagram describing the sequence of process steps.
- Object state diagram.
The following standard conventions are used:
Functional element of behavior, |
|
Transferring an action from one functional element of behavior (preceding) to another (subsequent) ( precedence ), |
|
Transition of data flow from work to work ( object flow ), |
|
Relationship of data to work ( Referent ), |
|
Communication between works ( relational ), |
|
The state of the object. |
The regulation of the sequence of execution of units of work is carried out by introducing into the diagram crossroads (Junction) for different purposes.
Symbol J intersection can take one of the following values:
- & – merger the results of all actions if the arrows enter the intersection; launch all actions if the arrows go out of it;
- ABOUT - merger results of actions if at least one of the input actions is completed; launch at least one action
- X - merger only one action from a number included in the intersection; launch only one action from emerging from it.
An illustration of the use of an intersection in diagrams describing the sequence of process steps is fig. 2.15. It follows from it that the intersection is a means of constructing complex branched technological processes.
Description of the technology being developed or researched in the form of first diagrams describing the sequence of stages of the technological process , and then in the form object state diagrams gives a complete picture of the actions performed and the results of their application.
| Job 3 happens when Job 1 and Job 3 are done |
| Job 1 and Job 2 happen together |
| Job 3 occurs when Job 1 or Job 2 or both are done |
| Job 1 and Job 2 happen together or separately |
| Job 3 happens when Job 1 or Job 2 is done |
|
| Job 1 or Job 2 in progress |


Consequently, in the hands of managers and developers of information systems there is a powerful tool for creating scenarios for complex management processes that require study and automation.
4.4. IDEF3 modeling workflow
Model preparation
- Press the button for creating a model.
- In the dialog box BPWin do the following:
- select Process Flow (IDEF3);
- set the name of the model;
- press the button OK;
- in the dialog box Properties for New Model confirm the properties specified there.
Making an action
- Click the create action button ( Activity BoxTool ).
- Click the left mouse button at the desired location in the model window.
- In the context menu of the action, select the command Name…
- In the dialog box Activity Properties, in the bookmark Name set the name of the action (Fig. 2.16).

- In the dialog box Activity Properties bookmark Font ask Arial Cyr, OK.
Data formatting
- Click the create data button. ( Reference Tool ).
- in the right place on the window Referent left-click to embed data names from the created entity dictionary (option entity) or from the created dictionary of arrows (option Arrow), or create them again (option Other) (Fig. 2.17).

- In dialogue Referent Properties window (Fig. 2.18), in the tab Font ask Arial Cyr select the required checkboxes and click the button OK.

5. Homework for the next lesson
- Think over and define material objects or individuals that are sources or receivers of information (external entities).
- Think over and develop a relational model of data processed by the information system:
- make a list of entities and their attributes,
- show relationships between entities.
- Based on the developed terms of reference, think over and offer the teacher the names of individual works implemented in the system in the process of performing each of the key works placed in the second-level decomposition diagram.
- Fulfillment of p.p. Fix 1–3 homework assignments in a file with the name “ Information for the 3rd lesson.doc ”, made in Word, and presented to the teacher.
- Work through the section Theoretical information for a practical lesson» workshop on the 3rd lesson.
1.6. Fragment of the diagram of the node tree (Node Tree Diagram) when performing the decomposition of the block accounting for activities according to the second option (IDEF3)

Activity Dictionary
Name |
Definition |
Analysis of information read from the database to meet the specified criteria |
|
Document Analysis |
Analysis of accompanying and incoming documents for compliance with regulations |
Database maintenance |
Performing Data Refresh Operations |
PERFORMED |
The name of the context function that defines the PURPOSE and LIMITS of the simulation |
Finishing |
Making and formulating a decision (POSITIVE if the data meets the specified criteria and NEGATIVE otherwise), as well as creating and processing the necessary documents |
Quality control |
Work that completes a manufacturing or development process |
Data processing |
Performing data search and analysis operations and making a decision based on the analysis |
Processing of quality control results |
Systematization and analysis of results for compliance with the standard |
Processing test results |
Analysis of the results for serviceability, reliability and survivability |
Paperwork |
Acceptance of documents and selection of information for entering into the database |
Searching for data in database tables based on queries created by the user |
|
Database replenishment |
Entering new data into database tables |
Reception and registration of documents |
Reception and registration of incoming accompanying documents |
Production or development |
Name of the key business process of the company (model of the production part of the subject area) |
Work at the 1st stage of the business process1 |
An action summarizing technological operations at the first stage of the production process |
Work at the 2nd stage of the business process1 |
An action summarizing technological operations at the second stage of the production process |
Work at the 3rd stage of the business process1 |
An action summarizing technological operations at the third stage of the production process |
Processing the results of production activities |
Acceptance and analysis of documents based on the results of ongoing work and control |
Database editing |
Changing records in database tables |
ACCOUNTING |
Document processing and reporting (non-production domain model) |
Arrow Dictionary
Name |
Definition |
Objects that do not meet the requirements of the standard |
|
INPUT DATA |
Incoming documents and processing objects |
DB input |
Data to write to database tables |
Incoming Documents |
Documents accompanying processing objects and documents initiating a business process |
OUTPUT |
Outgoing documents, new and changed objects |
Outgoing documents |
Documents (forms, reports, instructions, statements, contracts, etc.) created in the accounting process |
State standard |
State standard for paperwork |
DB table data |
Data read from database tables |
Data obtained from the analysis |
Information intended for processing outgoing documents and used in making a decision |
Data characterizing the results of working with documents |
Information reflecting the details (qualitative and quantitative characteristics) of the processed objects |
Documents on the results of testing and control |
Documents reflecting the data obtained at the stage of the final stage of processing objects |
Job description |
Instruction reflecting the duties of the performer |
User requests |
|
New and changed objects |
Objects created and modified during the implementation of the production cycle |
DB objects |
Tables, forms, queries, reports, macros and modules |
Processing objects |
Objects that are changed at different stages of the execution of the production process |
Objects processed at the 1st stage |
Objects that are modified at the 1st stage of the production process |
Objects processed at the 2nd stage |
Objects that are modified at the 2nd stage of the production process |
Objects processed at the 3rd stage |
Objects that are modified at the 3rd stage of the production process |
Technical control department that checks the created object for compliance with the requirements of the standard |
|
Departments of the company and specialists-professionals |
Entities involved in the production process or in the development process |
RULES OF PERFORMANCE |
Process and Data Transformation Rules |
Accounting rules |
The system of accounting and registration of documentation accompanying the production process or the development process |
DECISION |
A positive or negative decision made depending on the satisfaction of the analyzed data with specified criteria |
Accepted Documents |
Documents that have been registered |
Software |
The platform on the basis of which the developed database is implemented |
Document Analysis Results |
The results obtained after the analysis of incoming and accompanying documents for compliance with standards |
Quality control results |
|
searching results |
Information from database tables obtained by user requests |
Test results |
Data received at the final stage of processing |
User guide |
Instructions and rules for working with the database |
Accounting service |
Departments engaged in the process of accounting and documentation |
Accompanying documents |
Documents accompanying incoming processing objects |
Specialists-professionals |
Entities involved in production activities |
Technological instruction |
Process flow |
User requests |
Queries created by the user to select the necessary information from the database and to create output documents |
MECHANISM OF EXECUTION |
Resources that convert input to output |
New entries |
Records in database tables that appeared after entering new data |
Correction |
|
Subject conducting the examination |
print version
Most of those involved in the implementation of projects related to the creation or development of corporate information systems agree with the thesis that the customer needs an information system that increases the efficiency of the enterprise. However, customers and developers of information systems still speak different languages: they understand differently what it means to increase the efficiency of an enterprise.
Developers of information systems very often understand an increase in efficiency as an increase in the number of workstations in the local area network (LAN) of an enterprise, an increase in LAN bandwidth, an increase in the number of documents processed at automated workstations (AWPs), etc.
Customers understand the increase in the efficiency of the enterprise as an increase in labor productivity, a decrease in prime cost and an increase in the quality of products and services produced. Recently, new conditions and new concepts are rapidly breaking into the lives of customers: development strategy, core competencies, business architecture, business rules, and much more.
In order for the customer and the developer of the information system to understand each other, it is necessary for the developer to reorient from solving technical problems of creating or developing an information system to solving complex problems to improve the efficiency of the customer's enterprise. With this approach, the problem of an effective way to study the scope of the customer's activity comes to the fore:
- examination of the existing business architecture, business processes, business rules, information flows;
- identification of problems, "bottlenecks" that adversely affect the efficiency of the enterprise;
- development and implementation of measures to eliminate existing problems and change the business architecture of the enterprise, restructuring business processes;
- development of a specific project of a corporate information system, implementation of this project and support in the future.
Within the framework of this approach, tools designed for enterprise modeling and re-engineering of business processes are called upon to increase the efficiency of the information systems developer. One of the representatives of this family of tools are CASE-tools for functional modeling of business processes.
This article provides an overview of one class of tools for functional modeling of business processes, focused on using the IDEF0 methodology.
IDEF0 - functional modeling methodology
During the implementation of the integrated computerization of production (ICAM) program, proposed at one time by the Air Force for the US aerospace industry, a need was identified to develop methods for analyzing the interaction of processes in production systems. To meet this need, the IDEF0 (Integrated Definition Function Modeling) methodology was developed and is now accepted as a US federal standard. The methodology has been successfully applied in a wide variety of industries, demonstrating itself as an effective tool for analyzing, designing and presenting business processes. Currently, the IDEF0 methodology is widely used not only in the United States, but throughout the world. In Russia, IDEF0 has been successfully applied in government institutions (for example, in the State Tax Inspectorate), in the aerospace industry (in the design of the Plesetsk cosmodrome), in the Central Bank and commercial banks of Russia, in the oil and gas industry and enterprises in other industries.
Basic Concepts of IDEF0
The IDEF0 methodology is based on the concept of a block that displays some business function. The four sides of the block have different roles: the left side has the meaning of "input", the right side - "output", the top - "control", the bottom - "mechanism" (see Fig. 1).
The interaction between functions in IDEF0 is represented as an arc that represents the flow of data or material coming from the output of one function to the input of another. Depending on which side of the block the flow is associated with, it is called "input", "output", "control" respectively.
Modeling Principles in IDEF0
IDEF0 implements three basic process modeling principles:
- principle of functional decomposition;
- the principle of complexity limitation;
- context principle.
The principle of functional decomposition is a way of modeling a typical situation when any action, operation, function can be broken down (decomposed) into simpler actions, operations, functions. In other words, a complex business function can be represented as a set of elementary functions. Representing functions graphically, in the form of blocks, one can, as it were, look inside the block and examine in detail its structure and composition (see Fig. 2).

The principle of limiting complexity. When working with IDEF0 diagrams, the condition of their legibility and readability is essential. The essence of the complexity limitation principle is that the number of blocks in the diagram must be at least two and no more than six. Practice shows that compliance with this principle leads to the fact that the functional processes presented in the form of an IDEF0 model are well structured, understandable and easy to analyze.
The principle of the context diagram. Business process modeling begins with the construction of a context diagram. This diagram displays only one block - the main business function of the system being modeled. When it comes to modeling an entire enterprise or even a large division, the main business function cannot be formulated as, for example, "sell products." The main business function of the system is the "mission" of the system, its significance in the surrounding world. It is impossible to correctly formulate the main function of the enterprise without having an idea of its strategy.
When defining the main business function, you must always keep in mind the purpose of the modeling and the point of view of the model. The same enterprise can be described in different ways, depending on the point of view from which it is considered: the director of the enterprise and the tax inspector see the organization in completely different ways.
The context diagram plays another role in the functional model. It "fixes" the boundaries of the business system being modeled by defining how the modeled system interacts with its environment. This is achieved by describing the arcs connected to the box representing the main business function.
Application of IDEF0
After getting acquainted with the basic concepts and principles of functional modeling of business processes, the question is natural: how does this help to improve the efficiency and quality of the enterprise.
Building the model AS IS. An enterprise survey is an obligatory part of any project for the creation or development of a corporate information system. Building a functional model AS IS allows you to clearly fix what business processes are carried out at the enterprise, what information objects are used in the performance of business processes and individual operations. The AS-IS functional model is the starting point for analyzing the needs of the enterprise, identifying problems and bottlenecks, and developing a business process improvement project.
Business rules. The business process model allows you to identify and accurately define the business rules used in the activities of the enterprise.
On fig. 3 shows a fragment of the functional model of workflow. When performing the "sort documents" operation, the business rule is used: "registration is not subject to: documents sent in copies for information, telegrams and letters on permission for business trips and vacations ...". This rule is fixed in the instructions for document management. The functional model allows not only to identify the existence of this rule, but also to determine in which operation and at which workplace it should be applied.

Within the framework of the functional model, the business rule looks like this: "if the reception received a document intended for management, it is subject to sorting, as a result of which, based on the instruction, it is determined whether the document is subject to registration or not."
If this business rule is not taken into account when developing an information system, then such a system will function inadequately.
Very often, business rules in an enterprise are not written in instructions: they seem to exist, but they also seem to be absent. As a result, attempts to change something in the activities of an enterprise or department may fail only because these changes are contrary to established business rules.
Information objects. The functional model allows you to identify all the information objects that the enterprise operates in its activities. Unlike information models (Data Flow Diagrams, IDEF1X), the IDEF0 functional model reflects exactly how information objects are used within business processes.
Model Building HOW TO BE. The creation and implementation of a corporate information system leads to a change in the conditions for performing individual operations, the structure of business processes and the enterprise as a whole. This leads to the need to change the system of business rules used in the enterprise, modify the job descriptions of employees. The functional model HOW TO BE allows you to determine these changes already at the design stage of the future information system. The application of the functional model AS WILL not only reduce the time of implementation of the information system, but also reduce the risks associated with the immunity of personnel to information technologies.
Resource allocation. The functional model allows you to clearly define the distribution of resources between the operations of the business process, which makes it possible to evaluate the efficiency of resource use.
This task is especially relevant when creating new business processes in the enterprise. For example, a company that specializes in the development of custom software has decided to create its own sales force. The functional model of the business process for selling software will allow the company's management to clearly determine what resources need to be allocated in order to ensure the functioning of the sales service, how many employees need to be attracted to work in the new service, what functional responsibilities these employees should perform, etc.
IDEF0 software systems
Currently, there are many CASE tools that support functional modeling in the IDEF0 standard.
CONCLUSION
The IDEF0 functional modeling methodology is a fairly simple tool that allows developers of corporate information systems to study the scope of the customer's activities and solve problems to improve the efficiency of this activity.
The use of functional modeling allows solving not only the customer's technical problems related to information technology, but also problems related to the customer's field of activity. This allows you to turn an information system project from a "pack of paper" that the customer does not want to pay for, into a service that can bring an additional effect to the customer, comparable to subsequent automation.
Known today not only in narrow circles, the abbreviation IDEF0 is the first methodology that standardizes work on business processes. It was developed in the middle of the last century as part of an aerospace project in the United States and, having shown its effectiveness, became a federal standard. In our country, in 2000, a document “ IDEF0 Functional Modeling Methodology. Guidance document Functional Modeling Methodology IDEF0 Guidance Document. Official edition. State Standard of Russia RD IDEF0 - 2000. Developed by the Research Center for CALS - technologies "Applied Logistics". Adopted and put into effect by the Decree of the State Standard of Russia 2000 Moscow”, but as a standard it was never approved. Although this did not prevent this methodology from becoming one of the most popular tools for graphical modeling of business processes in our country. In this article, I suggest that you consider the IDEF0 model and evaluate the relevance of this approach at the present time.
Basic concepts and abbreviations
Let's deal a little with the names of the key elements of the methodology. The IDEF0 graphics standard is part of the SADT (Structured Analysis and Design Technique) methodology. IDEF is an abbreviation for ICAM Definition, and ICAM is derived from Integrated Computer Aided Manufacturing, which translates as integrated computerization of production. The SADT methodology is a whole family of 15 different models, which together were supposed to allow us to explore the structure, parameters and characteristics of production, technical and organizational and economic systems.
IDEF0 is a functional model, which is the core of building all other structures, it links together information and material flows, organizational structure, control actions and the company's activities. A graphical standard for process modeling is also commonly referred to as a notation. That is, notation is a system of requirements and rules for building an activity model in one form or another. Therefore, IDEF0 is appropriate to call the notation that is part of the SADT methodology.
The IDEF0 notation is a fairly rigorous technique that was originally developed, like engineering design standards, for manual modeling. Therefore, it contains requirements for the placement of arrows, the format of all elements, the content of the information frame for the IDEF0 diagram, etc. Since the company's activities are a complex multi-level system of actions, there are always a lot of schemes, and unambiguous systematization and navigation through all elements of the model is necessary. Now this is done mainly by computer systems that support modeling in this notation. AllFusion Process Modeler and Business Studio systems are the most famous and available on the territory of Russia today. I plan to devote separate articles to the review of these systems.
Function block
The central element of the IDEF0 model is the function , which is displayed in the diagram as function block- a rectangle inside which the action is indicated in the form of a verbal noun. The action can be very different in scale - from the activities of the company in general and to specific manipulation in particular. Examples: "Production and sale of ceramic dishes" and "Drawing on the product."

Required Function Block Elements in IDEF0
Regardless of the scale of actions, all functions are displayed uniformly and necessarily contain 4 key streams that are rigidly assigned to the sides of the functional block:
- on the left - inputs or resources used to execute the function;
- on the right - outputs or results of the function execution;
- above - control actions that determine how and how many results need to be produced;
- below - mechanisms that reflect who and with what should do this work.
This approach allows you to save a little on explanations in the diagrams and achieve unambiguity in the display of flows, which makes the whole model harmonious.
To build a functional model, the IDEF0 methodology requires the following rules to be observed.
- Inputs are resources that transfer their value to outputs completely, that is, they are completely spent on creating the result, and mechanisms are resources that transfer their value only partially (equipment through depreciation, and people through wages).
- Management is a necessary element of the model, as it ties all actions to the company's system of regulations, clearly indicating which rules and requirements must be observed in the process of performing a function. Often this stream is treated formally, but at the same time the scheme loses its rigor, and sometimes even its meaning.
- Each function block must have at least one arrow on each side (since there can be no work without resources or results, and an instruction without an executor or instruction will be incomplete).
The considered scheme is the "brick" of the IDEF0 approach. Functional modeling involves a gradual transition from the general to the particular through decomposition. Decomposition is a “deepening” into the function under consideration, dividing it into smaller functions. At the same time, when the top-level function is presented in a generalized way and then decomposed, it is appropriate to call it a process.
Context diagram
At the highest level, the company is seen as a "black box" in which some activity takes place that translates inputs into outputs. This level is usually called "", that is, a diagram that describes the context of the company's activities. Additionally, the context diagram displays the key characteristics of the entire model.
- The goal is a specific formulation of the purpose of the model, according to which the accuracy of building the model can be verified in the future.
- Point of view - from whose face the model is built, since the model is always dependent on its author and the focus of attention. If we are building a general model of an enterprise, then it is usually presented from the point of view of its director.
- The model type is an indication of what information is displayed on the diagrams. There can be 2 fundamental options here: AS IS (“as is”) or TO BE (“as will be”). This separation is necessary because we can build models for both the analysis of activity and its transformation. We must be clear about what we are doing and communicate this information to others.
Thus, the context diagram contains in the most generalized form a description of the company's activities, which are permeated by the flows that connect the company with the outside world. I think they should also be a little more detailed.
Main streams
Experience has shown that, despite the apparent simplicity and formality of this level, it is often necessary to linger on it for a long time, since all the results that are significant for the owner and the market should be reflected here. An error can lead to the creation of models that do not fulfill the tasks set for the business. To check that meaningful flows are shown, make sure that all 4 main types of flows are present in your diagram.
- Material: materials and components at the input and finished products at the output.
- Client: a potential client at the entrance and a satisfied one at the exit.
- Financial: at the input, this is usually investments, customer payments (revenue), loans and other income; the output is payments to suppliers, taxes, payments on loans and profits.
- Informational: at the input, these are all flows of information about the external environment (market conditions, competitor behavior, technological innovations, etc.), and at the output, this is the flow of information that the company reports about itself to the world (all advertising information, as well as all types of reporting to regulatory authorities).
Note that the company is an open system, and nothing comes and goes in it. The company is only able to convert incoming flows into outgoing ones, and if it does this well, then an additional cash flow (profit) appears, reflecting in a sense the quality of the entire system.

(click to enlarge)
It's good if you highlight each of these types of flows with a different color so that you can easily distinguish the movement of resources and not miss important points. For example, it is often possible to observe the absence of a client in the company's flows, therefore, work with him is based on a residual principle - the client often feels like a hindrance to the company's employees, whose tasks are focused on processing the flow of documents.
Control arrows can be represented by only 1 type of flow - informational, which can be divided into 2 subtypes. The first is documents such as:
- laws and regulations;
- orders, orders;
- instructions and regulations;
- plans;
- design documentation, etc.
The second is undocumented information, which most often includes the requirements of the owners.
And, finally, mechanisms - there are only 2 types of flows: equipment (material) and performers (divisions and people). There can be no documents here, just as there can be no people on the control arrows!
Continuous numbering is provided for navigation in the model. The context diagram is numbered "A-0". In the future, each functional block receives its own number, no matter how deep the decomposition is.
Decomposition
After working out the flows of the context diagram, we can move on to decomposition. Going one level down, as if opening a "black box", we first see a blank sheet with arrows that have been attached to the functional block.

(click to enlarge)
And this is where the actual functional modeling begins - we must understand what set of actions can connect these flows and ensure that all requirements are met. The difficulty lies in the fact that there are a lot of actions in the company, and we have the right to display no more than 9 functions on the diagram, otherwise the diagram will become unreadable and, accordingly, useless.
It is not always easy to arrange a complex activity in such a way that it remains visual, readable and at the same time complete. Most often, they resort to dividing the entire variety of processes into main large blocks, the most significant of which are the following.
- Creation of a product (result).
- Promotion and sale - work with a client flow.
- Ensuring product creation activities are secondary processes that are necessary to comply with government requirements or work convenience (personnel and accounting, transport services, cleaning of premises, etc.).
- Creation of control flows is the activity of developing management decisions that will determine the requirements for all company processes.
The figure below shows the decomposition diagram of our example.

(click to enlarge)
In the diagram, the processes should be located diagonally - this is called principle of dominance, which implies the arrangement of functional blocks from left to right and from top to bottom - in order of importance or in chronological order. The block numbering is the same.
Further work on the model is similar to the first step - the decomposition of each functional block of the first level is carried out. The block numbering will contain the number of the first level: A1.1 ... A1.n, A2.1 ... A2.n, etc.
Conclusions about the relevance of the notation
Within the framework of this article, it was possible to display only the basic concepts of the IDEF0 notation using a short example of IDEF0, by which, of course, it is difficult to judge the methodology as a whole. But a fairly large experience of using this notation in practice allows me to draw the following conclusions.
- The model has a good visualization potential, but, in my opinion, its greater value is in the disciplinary effect. The rules and restrictions laid down in the methodology make it necessary to develop a systematic and strict attitude to the models, which has a very good effect on the quality of the final result.
- The model allows you to build communication flows between externally not strongly connected things: to connect the subsystems of the front and back offices with management, which is much worse for other notations.
- The approach is simple and understandable for most project participants. Building and reading diagrams in this notation is limited only by the desire to delve into the intricacies of business flows.
Some of the above arguments lead one to think that this approach is the best and only one for complete activity modeling. But we must not forget that the functional model is designed only for the upper level of modeling. Using the IDEF0 notation for designing work at the level of performers leads to the fact that the schemes are purely illustrative and it is impossible to build an explanatory regulation on their basis, since they do not contain:
- specifying the start and stop events of the process;
- conditions for the transition from one action to another;
- the ability to visually display all resources and performers without overloading the scheme with arrows.
Therefore, if you use this notation for the tasks for which it is intended (structuring top-level activities), then IDEF0 is practically the only notation today that allows you to do this meaningfully and accurately.
In project management, this modeling standard is most applicable where you need to link different projects or processes in visual flows. At the same time, the graphical model will allow for a more rational distribution of responsibility and resources among tasks. The logic of the project tasks, reflected in the diagrams, will help to prepare a better schedule in the form of a Gantt chart.
These recommendations for standardization are intended for use in the analysis and synthesis of production, technical and organizational and economic systems using functional modeling methods in various sectors of the economy.
The recommendations contain a description of a set of tools for visual representation of a wide range of business, production and other processes and operations of an enterprise at any level of detail,as well as organizational and methodological methods of using these funds.
The constant complication of production, technical and organizational and economic systems - firms, enterprises, industries and other subjects of production and economic activity - and the need to analyze them in order to improve functioning and increase efficiency necessitate the use of special tools for describing and analyzing such systems. This problem is of particular relevance in connection with the emergence of integrated computerized production and automated enterprises.
In the United States in the late 70s, the Integrated Computer Aided Manufacturing (ICAM) program was proposed and implemented, aimed at increasing the efficiency of enterprises through the widespread introduction of computer (information) technologies.
The implementation of the ICAM program required the creation of adequate methods for analyzing and designing production systems and ways of exchanging information between specialists dealing with such problems. To meet this need, within the framework of the ICAM program, the IDEF modeling methodology (ICAM Definition) was developed, which makes it possible to study the structure, parameters and characteristics of production, technical and organizational and economic systems.
IDEF Methodology
The general IDEF methodology consists of three particular modeling methodologies based on the graphical representation of systems:
IDEF0 is used to create a functional model that displaysstructure and functions of the system, as well as the flows of information and materialobjects converted by these functions;
IDEF1 is used to build an information model that displaysstructure and content of information flows necessary to supportsystem functions;
IDEF2 allows you to build a dynamic model of time-varyingbehavior of functions, information and resources of the system.
To date, the IDEF0 and IDEF1 (IDEF1X) methodologies are the most widespread and used.
The IDEF0 methodology, the features and techniques of which are described in these recommendations, is based on an approach called
SADT - Structured Analysis & Design Technique - a method of structural analysis and design. The basis of this approach and IDEF0 methodology is a graphical language for describing (modeling) systems.
General concepts
IDEF0 Model: A graphical description of a system designed for a specific purpose and from a selected point of view. A set of IDEF0 documents that depict system functions using graphics (diagrams), text, and a glossary.
Purpose: Brief statement of the reason for creating the model.
Point of view: an indication of the official or department of the organization from whose position the model is being developed. For each model, there is only one point of view.
Glossary: A list of definitions for keywords, phrases, and abbreviations related to nodes, blocks, arrows, or the IDEF0 model in general.
Text: Any text (non-graphical) comment on the IDEF0 graphic diagram.
Model Note: A text comment that is part of an IDEF0 diagram and is used to record a fact that did not find a graphic.
Function: An activity, process, or transformation (modeled by the IDEF0 block) identified by a verb or verb form that describes what is to be done.
Decomposition: division of the modeled function into component functions.
Context Diagram Example
Diagram
Diagram: part of the model that describes the decomposition of the block.
Context: The environment in which the feature (or set of features in a diagram) operates.
Context Diagram: A diagram with node number A-n (A minus n) that represents the context of the model. Diagram A-0, consisting of one block, is a necessary (mandatory) context diagram; diagrams with node numbers A–1, A–2, ..., are additional context diagrams (n > 0). Diagram A–0 (A minus zero): A special kind of IDEF0 (contextual) diagram consisting of a single box describing a top-level function, its inputs, outputs, controls, and mechanisms, together with statements of the purpose of the model and the point of view from which it is built. model.
Child Diagram: Diagram detailing the parent (parent) box.
Parent Chart: The chart that contains the parent box.
Nodal link: a code assigned to a diagram to identify it and determine its position in the model hierarchy; is formed from the abbreviated name of the model and the node number of the diagram with additional extensions.
Diagram Nodal Number: The part of the diagram's node link that corresponds to the parent box number.
Decomposition

In context diagram A–0, the Simulation Object is represented by a single box with boundary arrows representing the Simulation Object relationship.
with the environment.
A single function presented in a top-level context diagram can be decomposed into major sub-functions by creating child diagrams containing the detail of the parent blocks.
Block
Block: A rectangle containing a name and a number and used to describe a function.
Block Number: A number (0-6) placed in the lower right corner of the block that uniquely identifies the block in the diagram.
Block Name: A verb or verb phrase placed inside a block that describes the function being modeled.
Child box: a box on a child (child) chart.
Parent Box: A box that is described in detail by a child diagram.
Blocks have the following syntax rules:
The block sizes must be large enough to include the block name and number.
Blocks must be rectangular, with right angles;
Blocks should be drawn with solid lines.
Knot
Node: a block that spawns child blocks; parent block.
Node number: code assigned to the block and defining its position in the model hierarchy; can be used as a verbose reference expression.
Node tree: A representation of the relationship between parent and child nodes of an IDEF0 model in the form of a tree graph. Has the same meaning and content as the list of nodes.
Node List: A list, often staggered, showing the nodes of the IDEF0 model in an ordered fashion. Has the same meaning and content as the node tree.


Arrow
Arrow: A directed line, consisting of one or more segments, that models an open channel or a channel that transfers data or material objects from a source (arrow start point) to a consumer (end point with a "tip").Input Arrow: A class of arrows representing the input of an IDEF0 block, i.e. the data or material objects that the function transforms into an output. The input arrows are connected to the left side of the IDEF0 block.Output Arrow: A class of arrows representing the output of an IDEF0 block, i.e. the data or material objects produced by the function. The output arrows are connected to the right side of the IDEF0 block.Mechanism Arrow: A class of arrows that represent IDEF0 mechanisms, that is, the means used to execute a function; includes a special case of call arrow. Mechanism arrows are connected to the bottom side of the IDEF0 block.Control Arrow: A class of arrows that, in IDEF0, represent controls, that is, conditions under which the block will exit correctly. Data or objects modeled as controls can be transformed by a function that produces the appropriate output. Control arrows are associated with the top side of the IDEF0 block.
Arrow label: A noun or noun phrase associated with an arrow or arrow segment and defining its meaning.
Inner Arrow: An input, control, or output arrow whose ends connect the source and consumer, which are blocks of the same diagram. Differs from the boundary arrow.Boundary Arrow: An arrow with one end connected to a source or destination and the other end not attached to any box in the diagram. Displays the connection of the diagram with other blocks of the system and is different from the inner arrow.Arrow segment: A line segment that starts or ends on the side of a block, at a branch or merge point, or at a boundary (unconnected arrowhead end).Branching: splitting an arrow into two or more segments.Merging: Merging two or more arrow segments into one segment.Binding/unbinding: Combining arrow values into a composite value (binding into a "bundle"), or splitting arrow values (unbinding a "bundle"), expressed by merging or branching arrow syntax.Tilde: A small broken (wavy) line used to connect a label to a specific arrow segment or model note to a chart component.ICOM code: code that matches the border arrows of the child diagram with the arrows of the parent block; used for links (the abbreviation ICOM stands for Input - input, Control - control, Output - exit, Mechanism - mechanism).
Semantics of blocks and arrows

Each side of a function block has a standard purpose in terms of the block/arrow connection. In turn, the side of the block to which the arrow is attached uniquely determines its role.
Arrows have the following syntax rules:- Broken arrows change direction only at a 90° angle;- Arrows should be drawn with solid lines.
You can use lines of various thicknesses;
- Arrows can only consist of vertical or horizontal lines.
Diagonal segments are not allowed;
- The ends of the arrows must touch the outer border of the functional block,
but must not cross it;
The arrows must attach to the block on its sides.
Connection in corners is not allowed.