OLAP(from the English OnLine Analytical Processing - operational analytical data processing, also: analytical data processing in real time, interactive analytical data processing) - an approach to analytical data processing based on their multidimensional hierarchical representation, which is part of the broader field of information technology - business -analysts ().
For the catalog of OLAP solutions and projects, see the OLAP section on TAdviser.
From the user's point of view, OLAP-systems provide a means of flexible viewing of information in various slices, automatic obtaining of aggregated data, performing analytical operations of convolution, detailing, comparison in time. All this makes OLAP systems a solution with obvious advantages in the field of data preparation for all types of business reporting, involving the presentation of data in different sections and different levels of hierarchy - for example, sales reports, various forms of budgets, and so on. The advantages of such a presentation are obvious in other forms of data analysis, including forecasting.
Requirements for OLAP systems. FASMI
The key requirement for OLAP systems is speed, allowing them to be used in the process of an analyst's interactive work with information. In this sense, OLAP systems are opposed, firstly, to traditional RDBMSs, the selections from which with typical queries for analysts using grouping and aggregation of data are usually expensive in terms of waiting time and loading of RDBMS, therefore, interactive work with them at any significant amount data is complex. Secondly, OLAP systems are opposed to the usual flat-file data presentation, for example, in the form of commonly used traditional spreadsheets, where multidimensional data presentation is difficult and not intuitive, and operations to change the slice - the point of view of the data - also require time and complicate interactive work with data.
At the same time, on the one hand, data requirements specific to OLAP systems usually imply storing data in special structures optimized for typical OLAP tasks, on the other hand, the direct extraction of data from existing systems during the analysis would lead to a significant drop in their performance.
Therefore, an important requirement is to provide the most flexible import-export connection between existing systems acting as a data source and the OLAP system, as well as the OLAP system and external data analysis and reporting applications.
At the same time, such a link should satisfy the obvious requirements of supporting import-export from several data sources, implementing procedures for cleaning and transforming data, unifying the classifiers and reference books used. In addition, these requirements are supplemented by the need to take into account various data update cycles in existing information systems and unify the required level of data detail. The complexity and versatility of this problem led to the emergence of the concept of data warehouses, and, in a narrow sense, to the allocation of a separate class of utilities for converting and transforming data - ETL (Extract Transform Load).
Active data storage models
We pointed out above that OLAP assumes a multidimensional hierarchical representation of data, and, in a sense, is opposed to systems based on RDBMS.
This, however, does not mean that all OLAP systems use a multidimensional model to store active, "working" system data. Since the storage model of active data affects all requirements dictated by the FASMI test, its importance is emphasized by the fact that it is on this basis that OLAP subtypes are traditionally distinguished - multidimensional (MOLAP), relational (ROLAP) and hybrid (HOLAP).
However, some experts, led by the aforementioned Nigel Pends indicate that a classification based on one criterion is not complete enough. Moreover, the overwhelming majority of existing OLAP systems will be of the hybrid type. Therefore, we will dwell in more detail on the storage models of active data, mentioning which of them correspond to which of the traditional OLAP subtypes.
Storing active data in a multidimensional database
In this case, OLAP data is stored in a multidimensional DBMS that uses constructs that are optimized for this type of data. Typically, multidimensional DBMSs support all typical OLAP operations, including aggregation by the required hierarchy levels, and so on.
In a sense, this type of data storage can be called classic for OLAP. For him, however, all the steps for preliminary data preparation are fully required. Usually, the data of a multidimensional DBMS is stored on disk, however, in some cases, to speed up data processing, such systems allow storing data in RAM. For the same purposes, storage in the database of pre-calculated aggregate values and other calculated values is sometimes used.
Multidimensional DBMSs that fully support multiuser access with competing read and write transactions are quite rare; the usual mode for such DBMSs is single-user with read-only multiuser write access, or multiuser read-only.
Among the conditional shortcomings characteristic of some implementations of multidimensional DBMS and OLAP systems based on them, one can note their susceptibility to an unpredictable, from a user point of view, increase in the amount of space occupied by the database. This effect is caused by the desire to minimize the response time of the system, which dictates storing pre-calculated values of aggregate indicators and other quantities in the database, which causes a nonlinear growth in the volume of information stored in the database with the addition of new data values or measurements to it.
The degree of manifestation of this problem, as well as the associated problems of efficient storage of sparse data cubes, is determined by the quality of the applied approaches and algorithms of specific implementations of OLAP systems.
Storing active data in a relational database
OLAP data can also be stored in a traditional RDBMS. In most cases, this approach is used when trying to "painless" OLAP integration with existing accounting systems, or based on RDBMS data warehouses. At the same time, this approach requires the RDBMS to provide effective fulfillment of the FASMI test requirements (in particular, to ensure the minimum response time of the system) some additional capabilities. Typically, OLAP data is stored in denormalized form, and some of the pre-calculated aggregates and values are stored in special tables. When storing in a normalized form, the effectiveness of the RDBMS as a method for storing active data decreases.
The problem of choosing effective approaches and algorithms for storing pre-calculated data is also relevant for OLAP systems based on RDBMS, therefore manufacturers of such systems usually focus on the advantages of the approaches used.
In general, it is believed that OLAP systems based on RDBMS are slower than systems based on multidimensional DBMSs, including due to less efficient data storage structures for OLAP tasks, but in practice this depends on the characteristics of a particular system.
One of the advantages of storing data in an RDBMS is usually the greater scalability of such systems.
Storing active data in flat files
This approach assumes storing chunks of data in regular files. It is usually used as an addition to one of the two main approaches in order to speed up work by caching actual data on disk or in the RAM of the client PC.
Hybrid approach to data storage
Most manufacturers of OLAP systems promoting their complex solutions, often including, in addition to the OLAP system itself, a DBMS, ETL (Extract Transform Load) and reporting tools, currently use a hybrid approach to organizing the storage of active data of the system, distributing them in one way or another between RDBMS and specialized storage, and between disk structures and in-memory caching.
Since the effectiveness of such a solution depends on the specific approaches and algorithms used by the manufacturer to determine whether what data and where to store, then hastily draw conclusions about the initially greater efficiency of such solutions as a class without evaluating the specific features of the system under consideration.
OLAP(eng. on-line analytical processing) - a set of methods for dynamic processing of multidimensional queries in analytical databases. Such data sources are usually quite large, and in the tools used to process them, one of the most important requirements is high speed. In relational databases, information is stored in separate tables that are well normalized. But complex multi-table queries in them are quite slow. Significantly better rates of processing speed in OLAP systems are achieved due to the peculiarities of the data storage structure. All information is clearly organized and two types of data stores are applied: measurements(contain directories divided by categories, for example, points of sale, customers, employees, services, etc.) and facts(characterize the interaction of elements of different dimensions, for example, on March 3, 2010, seller A rendered a service to customer B in store C in the amount of D monetary units). Measures are applied to calculate the results in the Analytic Cube. Measures are collections of facts aggregated across the corresponding selected dimensions and their members. These features make complex queries with multidimensional data much less time consuming than relational sources.
One of the main vendors of OLAP systems is Microsoft Corporation. Let's look at the implementation of OLAP principles using practical examples of creating an analytical cube in Microsoft SQL Server Business Intelligence Development Studio (BIDS) and Microsoft Office PerformancePoint Server Planning Business Modeler (PPS) applications and get acquainted with the possibilities of visual representation of multidimensional data in the form of graphs, charts and tables.
For example, in BIDS, you need to create an OLAP cube based on data about an insurance company, its employees, partners (customers) and points of sale. Let's assume that the company provides one type of service, so there is no need to measure services.
Let's define the measurements first. The following entities (data categories) are associated with the company's activities:
- Points of sale
- Employees
- Partners
Next, you need one table for storing facts (fact table).
Information in tables can be entered manually, but the most common loading of data using the import wizard from various sources.
The following figure illustrates the flow of manually creating and populating dimension and fact tables:
Fig. 1. Dimension and fact tables in the analytical database. Sequence of creation
After creating a multidimensional data source in BIDS, it is possible to view its Data Source View. In our example, you get the circuit shown in the figure below.
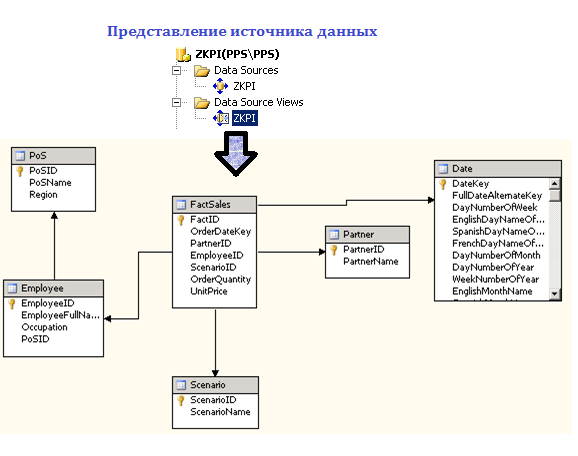
Fig. 2. Data Source View in Business Intellingence Development Studio (BIDS)
As you can see, the fact table is linked to the dimension tables by means of one-to-one correspondence of identifier fields (PartnerID, EmployeeID, etc.).
Let's see the result. On the cube browser tab, by dragging and dropping measures and dimensions into the total, row, column and filter fields, we can get a view of the data of interest (for example, concluded deals under insurance contracts concluded by a certain employee in 2005).
In 1993, the founder of the relational approach to building databases, Edgar Codd and partners (Edgar Codd, mathematician and IBM Fellow), published an article initiated by Arbor Software (today it is the famous company Hyperion Solutions), entitled "OLAP (operational analytical processing) for user-analysts ", which formulates 12 features of OLAP technology, which were subsequently supplemented by six more. These provisions have become the main content of a new and very promising technology.
The main features of OLAP technology (Basic):
- multidimensional conceptual representation of data;
- intuitive data manipulation;
- availability and detail of data;
- batch data extraction versus interpretation;
- OLAP analysis models;
- client-server architecture (OLAP is accessible from the desktop);
- transparency (transparent access to external data);
- multiplayer support.
Special Features:
- processing of unformalized data;
- saving OLAP results: keeping them separate from the original data;
- elimination of missing values;
- handling of missing values.
Features of presentation of reports (Report):
- flexibility in generating reports;
- standard reporting performance;
- automatic configuration of the physical layer of data extraction.
Dimension management:
- universality of measurements;
- unlimited number of dimensions and aggregation levels;
- unlimited number of operations between dimensions.
Historically, today the term "OLAP" implies not only a multidimensional view of data from the end user, but also a multidimensional representation of data in the target database. This is the reason why the terms "Relational OLAP" (ROLAP) and "Multidimensional OLAP" (MOLAP) appeared as independent terms.
OLAP service is a tool for analyzing large amounts of data in real time. By interacting with the OLAP system, the user will be able to perform flexible viewing of information, obtain arbitrary data slices and perform analytical operations of detailing, convolution, end-to-end distribution, comparison over time in many parameters simultaneously. All work with the OLAP system takes place in terms of the subject area and allows you to build statistically sound models of the business situation.
OLAP software is a tool for online analysis of the data contained in a warehouse. The main feature is that these tools are intended to be used not by a specialist in the field of information technology, not by an expert-statistician, but by a professional in the applied field of management - a manager of a department, department, management, and, finally, a director. The tools are designed for the analyst to communicate with the problem, not with the computer. In fig. 6.14 shows an elementary OLAP cube that allows you to evaluate data in three dimensions.
A multidimensional OLAP cube and a system of corresponding mathematical algorithms for statistical processing allows you to analyze data of any complexity at any time intervals.
Rice. 6.14. Elementary OLAP Cube
Having at his disposal flexible mechanisms for manipulating data and visual display (Fig. 6.15, Fig. 6.16), the manager first looks at the data from different angles, which may or may not be related to the problem being solved.
Next, he compares various business indicators with each other, trying to reveal hidden relationships; can look at the data more closely, detailing it, for example, by decomposing it into components by time, by region, or by client, or, conversely, generalize the presentation of information even more to remove distracting details. After that, using the module of statistical estimation and simulation, several scenarios for the development of events are constructed, and the most acceptable option is selected from them.

Rice. 6.15.
A company manager, for example, may develop a hypothesis that the spread of asset growth in various branches of a company depends on the ratio of specialists with technical and economic education in them. To test this hypothesis, the manager can query from the warehouse and display on the graph the ratio of interest for those branches whose asset growth has decreased by more than 10% in the current quarter compared to the previous year, and for those which have increased by more than 25%. He should be able to use a simple selection from the offered menu. If the results obtained noticeably fall into two corresponding groups, then this should become an incentive for further testing the hypothesis put forward.
Currently, a direction called Dynamic Simulation has developed rapidly, which fully implements the above FASMI principle.
Using dynamic modeling, the analyst builds a model of a business situation evolving over time, according to a certain scenario. At the same time, the result of such modeling can be several new business situations that generate a tree of possible solutions with an assessment of the likelihood and prospects of each.

Rice. 6.16. Analytical IS of data extraction, processing and information presentation
Table 6.3 shows the comparative characteristics of static and dynamic analysis.
The concept of OLAP technology was formulated by Edgar Codd in 1993.
This technology is based on the construction of multidimensional datasets - the so-called OLAP cubes (not necessarily three-dimensional, as one might conclude from the definition). The purpose of using OLAP technologies is to analyze data and present this analysis in a form that is convenient for management personnel to perceive and make decisions based on them.
Key requirements for multivariate analysis applications:
- - providing the user with the analysis results in a reasonable time (no more than 5 s.);
- - multi-user access to data;
- - multidimensional data presentation;
- - the ability to access any information regardless of its storage location and volume.
OLAP-systems tools provide the ability to sort and select data according to specified conditions. Various qualitative and quantitative conditions can be specified.
The main data model used in numerous tools for creating and maintaining databases - DBMS, is the relational model. The data in it is presented in the form of a set of two-dimensional relationship tables linked by key fields. To eliminate duplication, inconsistency, reduce labor costs for maintaining databases, a formal apparatus for normalizing entity tables is used. However, its use is associated with additional time spent on generating responses to database queries, although memory resources are saved.
A multidimensional data model represents the object under study in the form of a multidimensional cube, more often a three-dimensional model is used. Dimensions or attribute attributes are plotted along the axes or faces of the cube. The base attributes are the filling of the cube cells. A multidimensional cube can be represented by a combination of three-dimensional cubes in order to facilitate perception and presentation in the formation of reporting and analytical documents and multimedia presentations based on the materials of analytical work in the decision support system.
Within the framework of OLAP technologies, based on the fact that the multidimensional presentation of data can be organized both by means of relational DBMSs and multidimensional specialized tools, there are three types of multidimensional OLAP systems:
- - multidimensional OLAP-MOLAP;
- - relational (Relation) OLAP-ROLAP;
- - mixed or hybrid (Hibrid) OLAP-HOLAP.
In multidimensional DBMSs, data is organized not in the form of relational tables, but in the form of ordered multidimensional arrays in the form of hypercubes, when all stored data must have the same dimension, which means the need to form the most complete basis of measurements. Data can be organized in the form of polycubes, in this version the values of each indicator are stored with their own set of measurements, data processing is performed by the system's own tool. The storage structure in this case is simplified, since there is no need for a multidimensional or object-oriented storage area. The huge labor costs for creating models and systems for transforming data from a relational model to an object model are reduced.
The advantages of MOLAP are:
- - faster, than with ROLAP, receipt of responses to requests - the time spent is one to two orders of magnitude less;
- - Many built-in functions are difficult to implement due to SQL limitations.
MOLAP restrictions include:
- - relatively small size of databases;
- - due to denormalization and preliminary aggregation, multidimensional arrays use 2.5-100 times more memory than the original data (memory consumption grows exponentially with an increase in the number of measurements);
- - there are no standards for the interface and data manipulation tools;
- - there are restrictions when loading data.
The effort required to create multidimensional data increases dramatically. in this situation, there are practically no specialized means of objectifying the relational data model contained in the information storage. The response time to queries often cannot meet the requirements for OLAP systems.
The advantages of ROLAP systems are:
- - the possibility of online analysis of the data directly contained in the data warehouse, since most source databases are relational;
- - with a variable dimension of the problem, RO-LAP win, because no physical reorganization of the database is required;
- - ROLAP systems can use less powerful client stations and servers, and the servers bear the bulk of the burden of processing complex SQL queries;
- - the level of information protection and differentiation of access rights in relational DBMSs is incomparably higher than in multidimensional ones.
The disadvantages of ROLAP systems are lower performance, the need for thorough elaboration of database schemas, special tuning of indexes, analysis of query statistics and consideration of the analysis findings when modifying database schemas, which leads to significant additional labor costs.
Fulfillment of these conditions allows, when using ROLAP systems, to achieve indicators similar to MOLAP systems in terms of access time, as well as surpass in memory savings.
Hybrid OLAP systems are a combination of tools that implement a relational and multidimensional data model. This allows you to dramatically reduce the cost of resources for the creation and maintenance of such a model, the response time to requests.
This approach takes advantage of the advantages of the first two approaches and compensates for their disadvantages. This principle is implemented in the most developed software products for this purpose.
The use of hybrid architecture in OLAP systems is the most appropriate way to solve the problems associated with the use of software tools in multivariate analysis.
The pattern detection mode is based on intelligent data processing. The main task here is to identify patterns in the processes under study, interrelationships and interactions of various factors, search for large "unusual" deviations, forecast the course of various essential processes. This area belongs to data mining.
4. Classification of OLAP products.
5. Principles of OLAP-clients work.
7. Spheres of application of OLAP-technologies.
8. An example of using OLAP-technologies for analysis in the field of sales.
1. The place of OLAP in the information structure of the enterprise.
The term OLAP is inextricably linked to the term Data Warehouse.
Data in the warehouse comes from operational systems (OLTP systems), which are designed to automate business processes. In addition, the warehouse can be replenished with external sources, such as statistical reports.
The task of the repository is to provide the "raw material" for analysis in one place and in a simple, understandable structure.
There is one more reason that justifies the appearance of a separate storage - complex analytical queries to operational information slow down the current work of the company, for a long time blocking tables and seizing server resources.
A storage is not necessarily a gigantic accumulation of data - the main thing is that it is convenient for analysis.
Centralization and convenient structuring are not all that an analyst needs. He still needs a tool for viewing and visualizing information. Traditional reports, even built on the basis of a single repository, lack one thing - flexibility. They cannot be twisted, expanded, or collapsed to obtain the desired view of the data. I wish he had such a tool that would allow expanding and collapsing data simply and conveniently! OLAP acts as such a tool.
Although OLAP is not a necessary attribute of a data warehouse, it is increasingly being used to analyze the information accumulated in this warehouse.
The place of OLAP in the information structure of the enterprise (Fig. 1).
Picture 1... PlaceOLAP in the information structure of the enterprise
Operational data is collected from various sources, cleaned, integrated and stored in a relational storage. Moreover, they are already available for analysis using various reporting tools. Then the data (in whole or in part) is prepared for OLAP analysis. They can be loaded into a special OLAP database or left in a relational storage. Its most important element is metadata, that is, information about the structure, placement and transformation of data. Thanks to them, efficient interaction of various storage components is ensured.
In summary, OLAP can be defined as a collection of multidimensional data analysis tools accumulated in the warehouse.
2. Operative analytical data processing.
The OLAP concept is based on the principle of multidimensional data presentation. In 1993, EF Codd addressed the shortcomings of the relational model, primarily by pointing out the impossibility of "combining, viewing and analyzing data from a multidimensional perspective, that is, in the most understandable way for corporate analysts", and identified general requirements for OLAP systems that extend functionality relational DBMS and includes multivariate analysis as one of its characteristics.
According to Codd, a multi-dimensional conceptual view is a multiple perspective consisting of several independent dimensions along which specific sets of data can be analyzed.
Simultaneous analysis across multiple dimensions is defined as multivariate analysis. Each dimension includes directions of data consolidation, consisting of a series of successive levels of aggregation, where each higher level corresponds to a greater degree of data aggregation for the corresponding dimension.
Thus, the Contractor dimension can be determined by the direction of consolidation, which consists of the levels of generalization "enterprise - department - department - employee". The Time dimension may even include two consolidation directions - year - quarter - month - day and week - day, because time counting by month and by week is incompatible. In this case, it becomes possible to arbitrarily select the desired level of information detail for each of the measurements.
The drilling down operation corresponds to the movement from the higher stages of consolidation to the lower ones; on the contrary, a rolling up operation means moving from lower levels to higher levels (Fig. 2).

Figure 2.Measurements and directions of data consolidation
3. Requirements for tools for on-line analytical processing.
The multidimensional approach emerged almost simultaneously and in parallel with the relational approach. However, only since the mid-nineties, or rather since
1993, interest in MSUBD began to acquire a general character. It was in this year that a new program article by one of the founders of the relational approach appeared E. Codda, in which he formulated 12 basic requirements for the means of implementation OLAP(Table 1).
Table 1.
|
Multidimensional data representation |
The tools must support a multidimensional conceptual view of the data. |
|
|
Transparency |
The user should not be aware of what specific means are used to store and process data, how the data is organized and where it comes from. |
|
|
Availability |
It is up to the tools to select and communicate with the best data source to respond to a given request. The tools should be able to automatically map their own logic to various heterogeneous data sources. |
|
|
Consistent performance |
Performance should practically not depend on the number of Dimensions in the request. |
|
|
Client-server architecture support |
The tools must work in a client-server architecture. |
|
|
Equality of all measurements |
None of the measurements should be basic, they should all be equal (symmetrical). |
|
|
Dynamic processing of sparse matrices |
Undefined values should be stored and handled in the most efficient way. |
|
|
Support for multi-user mode of working with data |
The tools must provide the ability to work for more than one user. |
|
|
Supports operations based on various dimensions |
All multidimensional operations (eg Aggregation) must be applied uniformly and consistently to any number of any dimensions. |
|
|
Ease of data manipulation |
The tools should have the most convenient, natural and comfortable user interface. |
|
|
Advanced presentation tools |
The tools should support various ways of visualizing (presenting) data. |
|
|
Unlimited number of dimensions and levels of data aggregation |
There should be no limit to the number of dimensions supported. |
Rules for evaluating software products of the OLAP class
The set of these requirements, which served as the de facto definition of OLAP, should be considered advisory, and specific products should be judged on the degree to which they are close to perfectly meeting all requirements.
Later, Codd's definition was revised into the so-called FASMI test, which requires an OLAP application to provide the ability to quickly analyze shared multidimensional information.
Remembering Codd's 12 Rules is too burdensome for most people. It turned out that you can summarize the OLAP definition with only five keywords: Fast Analysis of Shared Multidimensional Information - or, in short - FASMI (translated from English:F ast A nalysis of S hared M ultidimensional I nformation).
This definition was first formulated in early 1995 and has not needed revision since then.
FAST ( Fast ) - means that the system should be able to provide most of the responses to users within about five seconds. At the same time, the simplest requests are processed within one second and very few - more than 20 seconds. Research has shown that end users perceive the process to be unsuccessful if no results are received after 30 seconds.
At first glance, it may seem surprising that when receiving a report in a minute, which not so long ago took days, the user very quickly becomes bored while waiting, and the project turns out to be much less successful than in the case of an instant response, even at the cost of less detailed analysis.
ANALYSIS (Analysis)means that the system can handle any logical and statistical analysis specific to the application and ensures that it is saved in a form accessible to the end user.
It doesn't matter if this analysis is done in a vendor's own toolbox or in a bundled external software product such as a spreadsheet, it just needs to provide all the required analysis functionality in an intuitive way to end users. Analysis tools could include specific procedures such as time series analysis, cost allocation, foreign exchange transfers, target search, multidimensional structure changes, non-procedural modeling, exception detection, data extraction, and other application-dependent operations. Such capabilities vary widely among products, depending on the target orientation.
SHARED means that the system fulfills all privacy protection requirements (possibly down to the cell level) and, if multiple write access is required, ensures that modifications are blocked at the appropriate level. Not all applications need to write back data. However, the number of such applications is growing and the system must be able to handle multiple modifications in a timely, secure manner.
MULTIDIMENSIONAL - this is a key requirement. If you had to define OLAP in one word, you would choose it. The system should provide a multidimensional conceptual view of the data, including full support for hierarchies and multiple hierarchies, as this is definitely the most logical way to analyze a business and organization. There is no minimum number of dimensions to be processed because it is also application dependent, and most OLAP products have enough dimensions for the markets they target.
INFORMATION - it's all. The necessary information must be obtained where it is needed. However, a lot depends on the application. The power of various products is measured in terms of how much input they can process, but not how many gigabytes they can store. The power of the products varies greatly - the largest OLAP products can handle at least a thousand times more data than the smallest. There are many factors to consider in this regard, including data duplication, RAM required, disk space utilization, performance, data storage integration, and more.
The FASMI test is a reasonable and understandable definition of the goals that OLAP is focused on achieving.
4. ClassificationOLAP-products.
So, the essence of OLAP consists in the fact that the initial information for the analysis is presented in the form of a multidimensional cube, and the ability to arbitrarily manipulate it and obtain the necessary information sections - reports - is provided. In this case, the end user sees the cube as a multidimensional dynamic table that automatically summarizes data (facts) in different sections (dimensions), and allows you to interactively control calculations and the report form. The execution of these operations is ensured OLAP -machine (or machine OLAP calculations).
To date, many products have been developed in the world that implement OLAP -technologies. To make it easier to navigate among them, classifications are used OLAP -products: by the way of data storage for analysis and by location OLAP -cars. Let's take a closer look at each category OLAP products.
Classification by storage method
Multidimensional cubes are built on the basis of source and aggregate data. Both raw and aggregate data for cubes can be stored in both relational and multidimensional databases. Therefore, there are currently three methods of storing data: MOLAP (Multidimensional OLAP), ROLAP (Relational OLAP) and HOLAP (Hybrid OLAP ). Respectively, OLAP -Products are divided into three similar categories by way of data storage:
1. In the case of MOLAP , source and aggregate data are stored in a multidimensional database or in a multidimensional local cube.
2. In ROLAP -products, the source data is stored in relational databases or in flat local tables on a file server. Aggregate data can be placed in service tables in the same database. Conversion of data from a relational database to multidimensional cubes occurs on demand OLAP tools.
3. In case of use HOLAP architecture, the original data remains in the relational database, and the aggregates are placed in the multidimensional one. Building OLAP -cube is performed on request OLAP -Means based on relational and multidimensional data.
Location classification OLAP-cars.
On this basis OLAP -products are divided into OLAP servers and OLAP clients:
Server OLAP -means of calculation and storage of aggregate data are performed by a separate process - the server. The client application receives only the results of queries against multidimensional cubes that are stored on the server. Some OLAP -servers support data storage only in relational databases, some - only in multidimensional ones. Many modern OLAP -servers support all three ways of storing data:MOLAP, ROLAP and HOLAP.
MOLAP.
MOLAP is Multidimensional On-Line Analytical Processing, that is, Multidimensional OLAP.This means that the server uses a multidimensional database (MDB) to store data. The sense of using MDB is obvious. It can efficiently store data that is multidimensional in nature, providing a means of quickly servicing database queries. Data is transferred from a data source to a multidimensional database, and then the database is aggregated. The pre-calculation is what makes OLAP queries faster because the summary data has already been calculated. The request time becomes a function solely of the time required to access a particular piece of data and perform a calculation. This method supports the concept that work is done once and the results are then used over and over again. Multidimensional databases are a relatively new technology. The use of MDB has the same disadvantages as most of the new technologies. Namely, they are not as stable as relational databases (RDBs), and they are not optimized to the same extent. Another weak point of MDB is the impossibility of using most multidimensional databases in the process of data aggregation, so it takes time for new information to become available for analysis.
ROLAP.
ROLAP is Relational On-Line Analytical Processing, that is, Relational OLAP.The term ROLAP means that the OLAP server is based on a relational database. The original data is entered into a relational database, usually in a star or snowflake schema, which helps to reduce retrieval times. The server provides a multidimensional data model using optimized SQL queries.
There are a number of reasons for choosing a relational over a multidimensional database. RDB is a well-established technology with many opportunities for optimization. Real world use resulted in a more elaborate product. In addition, RDBs support larger data volumes than MDBs. They are just designed for such volumes. The main argument against RDBs is the complexity of the queries required to retrieve information from a large database using SQL. An inexperienced SQL programmer could easily burden valuable system resources by trying to execute some similar query, which is much easier to execute in MDB.
Aggregated / Pre-aggregated data.
Rapid query implementation is imperative for OLAP. This is one of the basic principles of OLAP - the ability to intuitively manipulate data requires quick retrieval of information. In general, the more computation it takes to get a piece of information, the slower the response. Therefore, in order to save a small time for the implementation of queries, the pieces of information that are usually accessed most often, but which at the same time require computation, are subjected to preliminary aggregation. That is, they are counted and then stored in the database as new data. An example of a data type that can be calculated in advance is summary data — for example, sales figures by month, quarter, or year — for which the actual data entered is daily figures.
Different vendors have different selection methods for parameters that require pre-aggregation and a number of pre-computed values. The aggregation approach affects both the database and query execution time. If more values are calculated, the likelihood that the user will ask for an already calculated value increases, and therefore the response time will be shorter, since there is no need to ask for the initial value for the calculation. However, if calculating all possible values is not the best solution - in this case, the size of the database will increase significantly, which will make it unmanageable, and the aggregation time will be too long. In addition, when numerical values are added to the database, or if they change, this information should be reflected in the pre-calculated values depending on the new data. Thus, updating the database can also take a long time in the case of a large number of pre-calculated values. Since the database is usually offline during aggregation, it is desirable that the aggregation time is not too long.
OLAP -the client is arranged differently. Building a multidimensional cube and OLAP -computations are performed in the memory of the client computer.OLAP -clients are also divided into ROLAP and MOLAP.And some may support both types of data access.
Each of these approaches has its own pros and cons. Contrary to popular belief about the advantages of server tools over client ones, in a number of cases the use of OLAP - the client for users can be more efficient and profitable than using OLAP servers.
Development of analytical applications using OLAP client tools is a fast process and does not require special training for the contractor. A user who knows the physical implementation of the database can develop an analytical application on his own, without the involvement of an IT specialist.
When using an OLAP server, you need to study 2 different systems, sometimes from different vendors - for creating cubes on the server, and for developing a client application.
The OLAP client provides a unified visual interface for describing cubes and customizing their user interfaces.
So, in what cases can the use of an OLAP client for users be more efficient and profitable than using an OLAP server?
· Economic feasibility of application OLAP -server occurs when the amount of data is very large and unbearable for OLAP - the client, otherwise the use of the latter is more justified. In this case OLAP -Customer combines high performance characteristics with low cost.
· Powerful analyst PCs are another good reason OLAP -clients. When applying OLAP -server, these capacities are not used.
Among the advantages of OLAP clients are the following:
· Implementation and maintenance costs OLAP - the client is significantly lower than the cost of OLAP server.
· Using OLAP - for a client with a built-in machine, data transmission over the network is done once. By doing OLAP -operations of new data streams are not spawned.
5. Principles of work OLAP-clients.
Let's look at the process of creating an OLAP application using the client tool (Figure 1).

Picture 1.Build an OLAP Application Using the ROLAP Client Tool
The principle of operation of ROLAP clients is a preliminary description of the semantic layer behind which the physical structure of the initial data is hidden. In this case, data sources can be: local tables, RDBMS. The list of supported data sources is product specific. After that, the user can independently manipulate objects that he understands in terms of the subject area to create cubes and analytical interfaces.
The OLAP server client works differently. In OLAP server, when creating cubes, the user manipulates the physical descriptions of the database. This creates custom descriptions in the cube itself. The OLAP Server client is configured per cube only.
When creating a semantic layer, the data sources - the Sales and Deal tables - are described in terms that are understandable to the end user and turn into "Products" and "Deals". The “ID” field from the “Products” table is renamed to “Code”, and “Name” to “Product”, etc.
Then the Sales business object is created. A business object is a flat table from which a multidimensional cube is formed. When a business object is created, the "Products" and "Deals" tables are combined by the "Code" field of the product. Since all the table fields are not required to be displayed in the report, the business object uses only the "Item", "Date" and "Amount" fields.
In our example, based on the Sales business object, we have created a report on sales of goods by month.
When working with an interactive report, the user can set filtering and grouping conditions with the same simple mouse movements. At this point, the ROLAP client accesses the data in the cache. On the other hand, the OLAP server client generates a new query against the multidimensional database. For example, by applying a filter by products in the sales report, you can get a report on the sales of the products of interest to us.
All OLAP application settings can be stored in a dedicated metadata repository, in an application, or in a multidimensional database system repository.The implementation depends on the specific software product.
Everything that is included in these applications is a standard look at the interface, predefined functions and structure, as well as quick solutions for more or less standard situations. For example, finance packages are popular. Pre-built financial applications will allow professionals to use familiar financial instruments without having to design a database structure or common forms and reports.
The Internet is a new form of the client. In addition, it bears the stamp of new technologies; a bunch of internet solutions differ significantly in their capabilities in general and in the quality of OLAP solutions in particular. There are many advantages to generating OLAP reports over the Internet. The most significant is the absence of the need for specialized software for accessing information. This saves the company a lot of time and money.
6. Choice of OLAP application architecture.
When implementing an information and analytical system, it is important not to make a mistake in choosing an OLAP application architecture. The literal translation of the term On-Line Analytical Process - "on-line analytical processing" - is often taken literally in the sense that the data entering the system is promptly analyzed. This is a delusion - the efficiency of the analysis has nothing to do with the real time of data update in the system. This characteristic refers to the response time of the OLAP system to user requests. At the same time, the analyzed data is often a snapshot of information "for yesterday", if, for example, the data in the storages is updated once a day.
In this context, the translation of OLAP as "interactive analytical processing" is more accurate. It is the ability to analyze data in interactive mode that distinguishes OLAP systems from systems for preparing regulated reports.
Another feature of interactive processing in the formulation of the founder of OLAP E. Codd is the ability to "combine, view and analyze data from the point of view of multiple dimensions, that is, in the most understandable way for corporate analysts." For Codd himself, the term OLAP denotes an exclusively specific way of representing data at the conceptual level - multidimensional. At the physical level, data can be stored in relational databases, but in reality OLAP tools tend to work with multidimensional databases, in which the data is organized in a hypercube (Figure 1).

Picture 1. OLAP- cube (hypercube, metacube)
Moreover, the relevance of these data is determined by the moment the hypercube is filled with new data.
Obviously, the formation time of a multidimensional database significantly depends on the volume of data loaded into it, so it is reasonable to limit this volume. But how can one not narrow the possibilities of analysis and not deprive the user of access to all the information of interest? There are two alternative paths: Analyze then query and Query then analyze.
Followers of the first path suggest loading generalized information into a multidimensional database, for example, monthly, quarterly, annual totals for departments. And if it is necessary to drill down on the data, the user is prompted to generate a report on the relational database containing the required selection, for example, by day for a given department or by months and employees of a selected department.
Supporters of the second way, on the contrary, offer the user, first of all, to decide on the data that he is going to analyze and to load it into a microcube - a small multidimensional database. Both approaches differ conceptually and have their own advantages and disadvantages.
The advantages of the second approach include the "freshness" of the information that the user receives in the form of a multidimensional report - a "microcube". The microcube is formed based on the information just requested from the current relational database. Working with the microcube is carried out in an interactive mode - obtaining slices of information and its detailing within the microcube is carried out instantly. Another positive point is that the design of the structure and filling of the microcube is carried out by the user "on the fly", without the participation of the database administrator. However, the approach also suffers from serious drawbacks. The user does not see the general picture and must be determined in advance with the direction of his research. Otherwise, the requested microcube may be too small and not contain all the data of interest, and the user will have to request a new microcube, then a new one, then again and again. The Query then analyze approach implements the BusinessObjects tool of the company of the same name and the tools of the Company Contour platform.Intersoft Lab.
With the Analyze then query approach, the amount of data loaded into a multidimensional database can be quite large, filling should be performed according to the rules and can take a lot of time. However, all these disadvantages pay off later, when the user has access to almost all the necessary data in any combination. Reference to the source data in a relational database is carried out only as a last resort, when detailed information is needed, for example, on a specific invoice.
The work of a single multidimensional database is practically not affected by the number of users accessing it. They only read the data available there, in contrast to the Query then analyze approach, in which the number of microcubes in the extreme case can grow at the same rate as the number of users.
This approach increases the load on IT services, which, in addition to relational ones, are also forced to serve multidimensional databases.These services are responsible for the timely automatic updating of data in multidimensional databases.
The most prominent representatives of the “Analyze then query” approach are PowerPlay and Impromptu tools from Cognos.
The choice of both the approach and the tool that implements it depends primarily on the goal pursued: you always have to balance between saving the budget and improving the quality of service for end users. It should be borne in mind that, strategically, the creation of information and analytical systems pursues the goal of achieving a competitive advantage, and not avoiding the cost of automation. For example, a corporate information and analytical system can provide the necessary, timely and reliable information about a company, the publication of which for potential investors will ensure the transparency and predictability of this company, which will inevitably become a condition for its investment attractiveness.
7. Spheres of application of OLAP-technologies.
OLAP is applicable wherever there is a multivariate data analysis task. In general, if you have some table with data, in which there is at least one descriptive column (dimension) and one column with numbers (measures or facts), an OLAP tool will usually be an effective tool for analyzing and generating reports.
Let's consider some areas of application of OLAP technologies, taken from real life.
1. Sales.
Based on the analysis of the sales structure, the issues necessary for making management decisions are resolved: about changing the assortment of goods, prices, closing and opening stores, branches, terminating and signing contracts with dealers, conducting or terminating advertising campaigns, etc.
2. Purchases.
The task is the opposite of sales analysis. Many enterprises purchase components and materials from suppliers. Merchants purchase goods for resale. There are many possible tasks in procurement analysis, from planning cash based on past experience, to control over managers choosing suppliers.
3. Prices.
Analysis of purchases is closely related to the analysis of market prices. The purpose of this analysis is to optimize costs, to select the most advantageous offers.
4. Marketing.
By marketing analysis we will mean only the area of analysis of buyers or customers-consumers of services. The task of this analysis is the correct positioning of the product, the identification of groups of buyers for targeted advertising, and the optimization of the assortment. The task of OLAP in this case is to provide the user with a tool to quickly, with the speed of thought, receive answers to questions that intuitively arise during the analysis of data.
5. Warehouse.
Analysis of the structure of stock balances in the context of types of goods, warehouses, analysis of the shelf life of goods, analysis of shipment by recipient and many other types of analysis important for the company are possible if the organization has warehouse accounting.
6. Cash flow.
This is a whole area of analysis, with many schools and methodologies. OLAP technology can serve as a tool for the implementation or improvement of these techniques, but in no way a replacement for them. Analyzes the cash turnover of non-cash and cash in terms of business transactions, counterparties, currencies and time in order to optimize flows, provide liquidity, etc. The composition of measurements strongly depends on the specifics of the business, industry, and methodology.
7. Budget.
One of the most fertile fields of application for OLAP technologies. It is not for nothing that no modern budgeting system is considered complete without the presence of OLAP tools for budget analysis in its composition. Most budget reports are easily built on the basis of OLAP systems. At the same time, the reports answer a very wide range of questions: analysis of the structure of expenses and income, comparison of expenses for certain items in different departments, analysis of dynamics and trends in expenses for certain items, analysis of cost and profit.
8. Accounts.
The classic balance sheet, consisting of an account number and containing incoming balances, turnovers and outgoing balances, can be perfectly analyzed in the OLAP system. In addition, the OLAP system can automatically and very quickly calculate the consolidated balances of a multi-branch organization, balances for the month, quarter and year, aggregated balances by the hierarchy of accounts, analytical balances based on analytical characteristics.
9. Financial reporting.
A technologically advanced reporting system is nothing more than a set of named indicators with values as of the date, which must be grouped and summed up in various aspects to obtain specific reports. When this is the case, then displaying and printing reports is the easiest and cheapest to implement in OLAP systems. In any case, the internal reporting system of the enterprise is not so conservative and can be rebuilt in order to save money on technical work on the creation of reports and to obtain the capabilities of multidimensional operational analysis.
10. Website traffic.
The log file of the Internet server is multidimensional in nature, which means it is suitable for OLAP analysis. The facts are: the number of visits, the number of hits, the time spent on the page and other information available in the log.
11. Production volumes.
This is another example of statistical analysis. Thus, it is possible to analyze the volumes of potatoes grown, steel smelted, goods produced.
12. Consumption of consumables.
Imagine a plant consisting of dozens of workshops, which consumes cooling, flushing liquids, oils, rags, sandpaper - hundreds of items of consumables. For accurate planning and cost optimization, a thorough analysis of the actual consumption of consumables is required.
13. Use of premises.
Another type of statistical analysis. Examples: analysis of the workload of classrooms, leased buildings and premises, the use of conference rooms, etc.
14. Employee turnover at the enterprise.
Analysis of staff turnover at the enterprise in the context of branches, departments, professions, educational level, gender, age, time.
15. Passenger traffic.
Analysis of the number of sold tickets and amounts in the context of seasons, directions, types of cars (classes), types of trains (aircraft).
The scope of application is not limited to this list. OLAP - technologies. For example, consider the technology OLAP -analysis in the field of sales.
8. Example of use OLAP -technologies for analysis in the field of sales.
Designing a multidimensional data representation for OLAP -analysis begins with the formation of a measurement map. For example, when analyzing sales, it may be advisable to single out individual parts of the market (developing, stable, large and small consumers, the likelihood of new consumers, etc.) and assess the sales volumes by products, territories, customers, market segments, distribution channels, etc. the size of orders. These directions form the grid of the multidimensional view of sales - the structure of its dimensions.
Since the activity of any enterprise takes place in time, the first question that arises in the analysis is the question of the dynamics of business development. The correct organization of the time axis will provide a qualitative answer to this question. Usually the time axis is divided into years, quarters, and months. Even more fragmentation into weeks and days is possible. The structure of the temporal dimension is formed taking into account the frequency of data receipt; may also be conditioned by the frequency of information demand.
The “product group” dimension is designed to reflect as closely as possible the structure of the products being sold. At the same time, it is important to observe a certain balance in order, on the one hand, to avoid excessive detailing (the number of groups should be visible), and on the other hand, not to miss a significant segment of the market.
The “Customers” dimension reflects the structure of sales by geographic location. Each dimension can have its own hierarchies, for example, in this dimension it can be a structure: Countries - Regions - Cities - Clients.
To analyze the performance of departments, you should create your own dimension. For example, you can distinguish two levels of the hierarchy: departments and their subdivisions, which should be reflected in the "Departments" dimension.
In fact, the dimensions "Time", "Products", "Customers" quite fully define the space of the subject area.
Additionally, it is useful to divide this space into conditional areas, taking as a basis the calculated characteristics, for example, the ranges of the volume of transactions in value terms. Then the whole business can be divided into a number of value ranges in which it is carried out. In this example, you can limit yourself to the following indicators: the amount of sales of goods, the number of goods sold, the amount of income, the number of transactions, the number of customers, the volume of purchases from manufacturers.
OLAP - the cube for analysis will look like (Fig. 2):

Figure 2.OLAP- a cube for analyzing the volume of sales
It is precisely such a three-dimensional array in OLAP terms that is called a cube. In fact, from the point of view of strict mathematics, such an array will not always be a cube: a real cube should have the same number of elements in all dimensions, while OLAP cubes do not have such a limitation. An OLAP cube does not have to be 3D at all. It can be both two- and multidimensional - depending on the problem being solved. Serious OLAP products are designed for about 20 dimensions. Simpler desktop applications support about 6 dimensions.
Far from all the elements of the cube should be filled: if there is no information about the sales of Product 2 to Customer 3 in the third quarter, the value in the corresponding cell will simply not be determined.
However, the cube itself is not suitable for analysis. If it is still possible to adequately represent or depict a three-dimensional cube, then with six- or nineteen-dimensional the situation is much worse. Therefore, before use, ordinary two-dimensional tables are extracted from the multidimensional cube. This operation is called "slicing" the cube. The analyst, as it were, takes and "cuts" the dimensions of the cube according to the labels of interest. In this way, the analyst takes a two-dimensional slice of the cube (report) and works with it. The structure of the report is shown in Figure 3.

Figure 3.Analytical report structure
Let's cut our OLAP - cube and get the sales report for the third quarter, it will look like this (Fig. 4).

Figure 4.Third Quarter Sales Report
You can cut the cube along a different axis and get a report on the sales of product group 2 during the year (Fig. 5).

Figure 5.Product sales quarterly report 2
Similarly, you can analyze the relationship with the customer 4, by cutting the cube at the label Clients(fig. 6)

Figure 6.Report on the delivery of goods to the client 4
You can drill down into the report by month or talk about the delivery of goods to a specific customer branch.
The main difference between facts and information is that we receive and take note of the data, and we can use the information to our advantage. Roughly speaking, information is analyzed and systematized data. Thanks to the information received on time, many firms manage to withstand both the financial crisis and the fiercest competition. It is not enough to collect facts and have all the data you need. You also need to be able to analyze them. Various support systems have been developed to make it easier for people to make important business decisions. It is for this purpose that various complex systems have been developed that allow you to analyze large arrays of heterogeneous data and turn them into information useful for a business user. The new field of business intelligence seeks to enhance the process management of business systems through the use of data warehouses and technologies.
The market of information systems for business today offers a diverse range of solutions that help an enterprise organize management accounting, ensure operational management of production and sales, and effectively interact with customers and suppliers.
A separate niche in the business systems market is occupied by analytical software products designed to support decision-making at the strategic level of enterprise management. The main difference between such tools and operational management systems is that the latter provide enterprise management in a "mode of operation", that is, the implementation of a well-defined production program, while analytical systems at the strategic level help the management of the enterprise to work out solutions in a "development mode".
The scale of the changes carried out can vary from deep restructuring to partial renewal of technologies at certain production sites, but, in any case, decision-makers are considering development alternatives, on which the fate of the enterprise depends in the long term.
No matter how powerful and developed the information system of the enterprise is, it cannot help in solving these issues, firstly, because it is tuned to stationary, well-established business processes, and secondly, it does not, and cannot be, information for making decisions regarding new areas of business, new technologies, new organizational decisions.
Thanks to OLAP (On-Line Analytical Processing) data processing technology, any organization can almost instantly (within five seconds) receive the data it needs to work. OLAP can be summarized in five keywords.
FAST (Fast) - this means that the search and delivery of the necessary information takes no more than five seconds. The simplest queries are processed in a second, and only a few complex queries have a processing time of more than twenty seconds. To achieve this result, various methods are used, from special forms of data storage to extensive pre-computation. Thus, you can get a report in a minute, which previously took days to prepare.
ANALYSIS (Analytical) says that the system can do any analysis, both statistical and logical, and then stores it in an accessible form.
SHARED means that the system provides the required privacy, down to the cell level
MULTIDIMENSIONAL - This is the main characteristic of OLAP. The system must fully support hierarchies and multiple hierarchies, since it is in this way that it is most logical to analyze both the business and the activities of organizations.
INFORMATION The information you need must be delivered where it is needed.
During the work of an organization, data related to its field of activity is always accumulated, which is sometimes stored in completely different places, and it is not easy and time-consuming to bring them together. It is in order to accelerate the acquisition of data for testing emerging business hypotheses that the technology of interactive analytical data processing or OLAP was developed. The main purpose of such OLAP systems is to quickly respond to arbitrary user requests. Such a need often arises when developing some important business project, when the developer needs a working hypothesis that has arisen. Most often, the information the user needs should be presented in the form of some kind of dependence - for example, how the sales volume depends on the product category, on the sales region, on the season, and so on. Thanks to OLAP, he has the ability to immediately receive the necessary data in the desired layout for the selected period.
Interactive OLAP technology transforms huge piles of reports and tons of data into useful and accurate information that will help an employee make an informed business or financial decision at the right time.
In addition, thanks to OLAP, processing efficiency increases, and the user can get large volumes of sorted (aggregated) information almost instantly. Thanks to OLAP, the user can clearly see how effectively his organization is working, has the ability to quickly and flexibly respond to external changes, and has the ability to minimize the financial losses of his organization. OLAP provides accurate information that improves the quality of your decisions.
The only drawback of business intelligence systems is their high cost. Building a personal information warehouse takes both time and a lot of money.
The use of OLAP technology in business allows you to quickly obtain the necessary information, which, at the request of the user, can be presented in the usual form - reports, graphs or tables.
System integration procedures for business structures are based on the use of joint ERP, CRM and SCM solutions. In many cases, the systems are supplied by different manufacturers, and the imported data must go through a data reconciliation procedure and presentation in the form of heterogeneous data. In a business environment, an unambiguous requirement is assumed - a complete analysis of the data, which involves viewing the consolidated reports from different points of view.
Different vendors have different presentation mechanisms. The heterogeneous representation procedure involves extraction, transformation, and loading (ETL). For example, in Microsoft SQL Server 2005 Analysis Services, the data consolidation problem is implemented using Data Source Views, which are types of data sources that describe analytical view models.
Business applications based on OLAP technologies, product examples. The most common applications of OLAP technologies are:
Data analysis.
The task for which OLAP tools were originally used and still remain the most popular. A multidimensional data model, the ability to analyze significant amounts of data and a quick response to requests make such systems indispensable for analyzing sales, marketing activities, distribution and other tasks with a large amount of initial data.
Product examples: Microsoft Excel Pivot Tables, Microsoft Analysis Services, SAP BW, Oracle Essbase, Oracle OLAP, Cognos PowerPlay, MicroStrategy, Business Objects.
Financial planning and budgeting.
A multidimensional model allows you to simultaneously enter data and easily analyze it (for example, plan-fact analysis). Therefore, a number of modern products of the CPM (Corporate Performance Management) class use the OLAP% model. An important task is multidimensional back calculation (backsolve, breakback, writeback), which allows you to calculate the required changes in detail cells when the aggregated value changes. It is a what-if analysis tool. to play various variants of events when planning.
Product examples: Microsoft PerformancePint, Oracle EPB, Oracle OFA, Oracle Hyperion Planning, SAP SEM, Cognos Enterprise Planning, Geac.
Financial consolidation.
Consolidating data in accordance with international accounting standards, taking into account ownership shares, various currencies and internal turnovers, is an urgent task in connection with the tightening requirements of auditing bodies (SOX, Basel II) and companies entering IPOs. OLAP technologies make it possible to speed up the calculation of consolidated reports and increase the transparency of the entire process.
Product examples: Oracle FCH, Oracle Hyperion FM, Cognos Controller.
Data warehouses and On-Line Analytical Processing (OLAP) technologies
are important elements of business decision support, which are increasingly becoming an integral part of any industry. The use of OLAP technologies as a tool for business intelligence gives more control and timely access to strategic
information that contributes to effective decision-making.
This provides the ability to simulate real-world forecasts and more efficient use of resources. OLAP enables an organization to respond more quickly to market demands.
Bibliography:
1. Erik Thomsen. OLAP Solutions: Building Multidimensional Information Systems Second Edition. Wiley Computer Publishing John Wiley & Sons, Inc., 2002.
2. OLAP council white paper, http://www.olapcouncil.org/research/whtpaply.htm
3. Gerd Stumme and Bernhard Ganter. Formal Concept Analysis _ Mathematical Foundations.