Annotation: The subject of this course is The UML - Unified Modeling Language. In the previous lecture, we talked about what UML is, about its history, purpose, ways of using the language, the structure of its definition, terminology and notation. It has been noted that a UML model is a set of diagrams. In this lecture, we will consider such questions: why we need several types of diagrams; types of diagrams; OOP and sequence diagramming
Before moving on to discussing the main material of this lecture, let's talk about why build any diagrams at all. The development of a model of any system (not only software) always precedes its creation or updating. This is necessary at least in order to more clearly imagine the problem being solved. Thoughtful models are very important both for interaction within the development team and for mutual understanding with the customer. After all, it allows you to make sure that the project is "architecturally consistent" before it is implemented in code.
We build models of complex systems because we cannot describe them completely, "take a look at them at a glance". Therefore, we single out only the properties of the system that are essential for a particular task and build its model that reflects these properties. The method of object-oriented analysis makes it possible to describe real complex systems in the most adequate way. But as systems become more complex, there is a need for good simulation technology. As we said in the previous lecture, a unified system is used as such a "standard" technology. modeling language(Unified Modeling Language, UML), which is a graphical language for the specification, visualization, design, and documentation of systems. Using UML, you can develop a detailed model of the system being created, reflecting not only its concept, but also specific implementation features. Within the framework of the UML model, all representations about the system are fixed in the form of special graphic structures called diagrams.
Note. We will not consider all, but only some of the types of charts. For example, the component diagram is not covered in this lecture, which is only a brief overview of diagram types. The number of chart types for a particular application model is not limited in any way. For simple applications, there is no need to build diagrams of all types without exception. Some of them may simply be missing, and this fact will not be considered an error. It is important to understand that the availability of diagrams of a certain type depends on the specifics of a particular project. Information about other (not discussed here) types of diagrams can be found in the UML standard.
Why You Need Multiple Types of Charts
First, let's define terminology. In the preface to this lecture, we repeatedly used the concepts of system, model, and diagram. The author is sure that each of us intuitively understands the meaning of these concepts, but to make it completely clear, let's look again at the glossary and read the following:
System- a set of interconnected controlled subsystems united by a common goal of functioning.
Yes, not very informative. What is a subsystem then? To clarify the situation, let's turn to the classics:
system call a set of subsystems organized to achieve a specific goal and described using a set of models, possibly from different points of view.
Well, there's nothing you can do, you have to look for the definition of a subsystem. It also says there that subsystem is a set of elements, some of which specify the behavior of other elements. Ian Sommerville explains the concept this way:
Subsystem is a system whose functioning does not depend on the services of other subsystems. The software system is structured as a set of relatively independent subsystems. Interactions between subsystems are also defined.
Also not very clear, but better. Speaking in "human" language, the system is represented as a set of simpler entities that are relatively self-sufficient. This can be compared to how, in the process of developing a program, we build a graphical interface from standard "cubes" - visual components, or how the program text itself is also divided into modules that contain subroutines that are combined according to a functional feature, and they can be reused, in the following programs.
Understand the concept of a system. During the design process, the system is considered from different points of view with the help of models, the various representations of which appear in the form of diagrams. Again, the reader may have questions about the meaning of the concepts models and diagrams. We think a beautiful, but not very clear definition models as a semantically closed system abstraction is unlikely to clarify the situation, so let's try to explain "in our own words."
Model- this is a certain (material or not) object that displays only the most significant characteristics of the system for this task. Models are different - tangible and intangible, artificial and natural, decorative and mathematical...
Let's give some examples. The plastic toy cars familiar to all of us, which we played with such passion in childhood, are nothing more than material artificial decorative real car model. Of course, in such a "car" there is no engine, we do not fill its tank with gasoline, the gearbox does not work in it (moreover, it is absent at all), but as a model, this toy fully fulfills its functions: it gives the child an idea about the car, because it displays its characteristic features are the presence of four wheels, a body, doors, windows, the ability to drive, etc.
In medical research, animal testing often precedes clinical trials of drugs in humans. In this case, the animal acts as material natural human models.
The equation shown above is also a model, but this is a mathematical model, and it describes the movement of a material point under the action of gravity.
It remains only to say what a diagram is. Diagram is a graphical representation of a set of elements. Usually depicted as a graph with vertices (entities) and edges (relations). There are many examples of diagrams. This is a block diagram familiar to all of us from school years, and installation diagrams for various equipment that we can see in user manuals, and a tree of files and directories on a disk, which we can see by running the tree command in the Windows console, and much, much more other. In everyday life, diagrams surround us from all sides, because a picture is easier for us to perceive than a text...
But back to software design (and not only). In this industry since using diagrams, you can visualize the system from different points of view. One of the diagrams, for example, can describe the interaction of the user with the system, the other - the change in the states of the system during its operation, the third - the interaction between the elements of the system, etc. A complex system can and should be represented as a set of small and almost independent models - diagrams, and none of them is sufficient to describe the system and get a complete picture of it, since each of them focuses on some particular aspect of the functioning of the system and expresses a different abstraction level. In other words, each model corresponds to some specific, particular point of view on the system being designed.
Despite the fact that in the previous paragraph we were very loose with the concept of a model, it should be understood that in the context of the above definitions no single diagram is a model. Diagrams are only a means of visualizing the model, and the two should be distinguished. Only a set of diagrams constitutes a system model and describes it most fully, but not one diagram taken out of context.
Types of charts
UML 1.5 defined twelve types of charts divided into three groups:
- four types of diagrams represent the static structure of the application;
- five represent the behavioral aspects of the system;
- three represent the physical aspects of system operation (implementation diagrams).
The current version of UML 2.1 hasn't made too many changes. Diagrams have slightly changed in appearance (frames and other visual improvements have appeared), notation has improved slightly, some diagrams have received new names.
However, the exact number canonical diagrams it is absolutely unimportant for us, since we will not consider all of them, but only some - for the reason that the number of diagram types for a particular model of a particular application is not strictly fixed. For simple applications, there is no need to build all diagrams without exception. For example, for a local application, it is not necessary to build a deployment diagram. It is important to understand that the list of diagrams depends on the specifics of the project being developed and is determined by the developer himself. If the curious reader still wants to know about all UML diagrams, we will refer him to the UML standard (http://www.omg.org/technology/documents/modeling_spec_catalog.htm#UML). Recall that the purpose of this course is not to describe absolutely all the possibilities of UML, but only to introduce this language, to give an initial idea of this technology.
So, we will briefly look at such types of charts as:
- use case diagram;
- class diagram;
- object diagram;
- sequence diagram;
- interaction diagram;
- state diagram;
- activity diagram;
- deployment diagram.
We will talk about some of these diagrams in more detail in the next lectures. For now, we will not focus on the details, but set ourselves the goal of teaching the reader to at least visually distinguish between the types of diagrams, to give an initial idea of the purpose of the main types of diagrams. So, let's begin.
Use Case Diagram
Any (including software) systems are designed taking into account the fact that in the course of their work they will be used by people and / or interact with other systems. The entities with which the system interacts in the course of its work are called actors, and each actor expects the system to behave in a strictly defined, predictable way. Let's try to give a more rigorous definition of an ector. To do this, we use a wonderful visual vocabulary for UML Zicom Mentor:
Hector (actor)- this is a set of logically related roles performed when interacting with precedents or entities (system, subsystem or class). An actor can be a person or another system, subsystem or class that represents something outside of the entity.
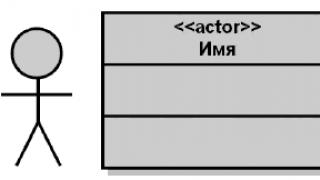
Graphically, the vector is depicted either " little man", similar to those that we drew in childhood, depicting members of our family, or class symbol with corresponding stereotype, as it shown on the picture. Both forms of presentation have the same meaning and can be used in diagrams. The "stereotyped" form is more often used to represent system actors or in cases where the actor has properties that need to be displayed (Fig. 2.1).
The attentive reader may immediately ask the question: Why is hector and not an actor?? We agree, the word "ektor" cuts the ear of a Russian person a little. The reason why we say this is simple - the ector is formed from the word action, which means in translation action. The literal translation of the word "ektor" - actor- too long and uncomfortable to use. Therefore, we will continue to say so.

Rice. 2.1.
The same attentive reader could notice the word "precedent" flashed in the definition of the ector. What is it? This question will interest us even more if we remember that we are now talking about use case diagram. So,
Precedent (use-case)- description of a particular aspect of the system behavior from the user's point of view (Butch).
The definition is quite understandable and exhaustive, but it can be further refined using the same Zicom Mentor"om:
use case- description of the set of successive events (including variants) performed by the system that lead to the result observed by the actor. A use case represents the behavior of an entity by describing the interaction between the actors and the system. A precedent does not show "how" a certain result is achieved, but only "what" it is.
Precedents are indicated in a very simple way - in the form of an ellipse, inside which its name is indicated. Use cases and actors are connected with lines. Often at one end of the line depict rice. 2.3
UML is now the standard notation for visual modeling of software systems, adopted by the Object Managing Group (OMG) in the fall of 1997 and supported by many object-oriented CASE products.
The UML standard offers the following set of diagrams for modeling:
Use case diagram (use case diagram) - for modeling the business processes of an organization or enterprise and determining the requirements for the information system being created;
class diagram (class diagram) - for modeling the static structure of the system classes and the relationships between them;
system behavior diagram (behavior diagrams);
interaction diagrams;
Sequence diagrams - for modeling the process of messaging between objects within one use case;
collaboration diagram (collaboration diagram) - for modeling the process of messaging between objects within the same use case;
statechart diagram - for modeling the behavior of system objects during the transition from one state to another;
activity diagram - for modeling the behavior of the system within the framework of various use cases, or modeling activities;
implementation diagram (implementation diagrams):
Component diagrams (component diagrams) - for modeling the hierarchy of components (subsystems) of an information system;
deployment diagram (deployment diagram) - for modeling the physical architecture of the designed information system.
On fig. 1.1 presents an integrated model of the information system, including the main diagrams to be developed in this course project.
Rice. 1. An integrated model of an information system in the notation of the UML language
4.2. Use case diagram
A use case is a sequence of actions performed by the system in response to an event triggered by some external object (actor). A use case describes a typical interaction between a user and a system. In the simplest case, the use case is determined in the process of discussing with the user the functions that he would like to implement in this information system. In UML, a use case is depicted as follows:

Fig.2. Use case
An actor is a role that a user plays in relation to the system. Actors represent roles, not specific people or job titles. Although they are depicted as stylized human figures in use case diagrams, an actor can also be an external information system that needs some information from the system. You should only show actors in a diagram when they really need some use cases. In UML, actors are represented as shapes:
Fig.3. Character (actor)
Actors are divided into three main types:
Users
systems;
Other systems interacting with this one;
Time becomes an actor if the triggering of any events in the system depends on it.
4.2.1. Relationships Between Use Cases and Actors
In UML, use case diagrams support several types of relationships between diagram elements:
Communication (communication),
Inclusion (include),
extension (extend),
generalization.
communication communication is the relationship between the use case and the actor. In UML, communication links are shown using a one-way association (solid line).

Fig.4. Communication link example
Inclusion connection used in situations where there is some piece of system behavior that is repeated in more than one use case. With the help of such links, a reusable function is usually modeled.
Extension connection used to describe changes in the normal behavior of a system. It allows one use case to use the functionality of another use case when needed.

Fig.5. An example of an inclusion and extension relationship
Communication generalization indicates that several actors or classes have common properties.

Fig.6. An example of a generalization relationship
4.3.
Interaction diagrams describe the behavior of interacting groups of objects. Typically, an interaction diagram only covers the behavior of objects within a single use case. Such a diagram displays a number of objects and the messages that they exchange with each other.
message is the means by which the sender object requests the receiver object to perform one of its operations.
Information (informative) message is a message that provides the receiving object with some information to update its state.
Request message (interrogative) is a message requesting the output of some information about the recipient object.
Imperative Message is a message that asks the receiver to perform some action.
There are two types of interaction diagrams: sequence diagrams and collaboration diagrams.
4.3.1. Sequence diagrams
sequence diagram reflects the flow of events occurring within a single use case.
All actors (actors, classes, or objects) involved in a given scenario (use case) are shown at the top of the diagram. Arrows correspond to messages passed between an actor and an object, or between objects to perform the required functions.
In a sequence diagram, an object is depicted as a rectangle, from which a dotted vertical line is drawn downward. This line is called lifeline of an object . It is a fragment of the life cycle of an object in the process of interaction.
Each message is represented as an arrow between the lifelines of two objects. Messages appear in the order they appear on the page from top to bottom. Each message is tagged with at least the message name. Optionally, you can also add arguments and some control information. You can show self-delegation, a message that an object sends to itself, with the message arrow pointing to the same lifeline.

Rice. 7. Sequence Diagram Example
4.3.2. Collaboration diagram
Cooperation Diagrams display the flow of events within a specific scenario (use case). Messages are ordered by time, although collaboration diagrams focus more on relationships between objects. A collaboration diagram shows all the information that a sequence diagram has, but a collaboration diagram describes the flow of events in a different way. From it it is easier to understand the connections that exist between objects.
In a collaboration diagram, just like in a sequence diagram, the arrows represent the messages that are exchanged within a given use case. Their time sequence is indicated by numbering the messages.

Rice. 8. An example of a cooperation diagram
4.4. class diagram
4.4.1. General information
class diagram defines the types of system classes and various kinds of static links that exist between them. Class diagrams also show class attributes, class operations, and constraints that are placed on relationships between classes.
A class diagram in UML is a graph whose nodes are the elements of the static structure of the project (classes, interfaces), and the arcs are the relationships between the nodes (associations, inheritance, dependencies).
The class diagram shows the following elements:
· Package (package) - a set of elements of the model, logically related to each other;
· Class (class) - description of common properties of a group of similar objects;
· Interface (interface) - an abstract class that specifies a set of operations that an object of an arbitrary class associated with a given interface provides to other objects.
4.4.2. Class
Class is a group of entities (objects) that have similar properties, namely data and behavior. An individual member of a class is called an object of the class, or simply an object.
The behavior of an object in UML refers to any rules for the interaction of an object with the outside world and with the data of the object itself.
In diagrams, a class is depicted as a rectangle with a solid border, divided by horizontal lines into 3 sections:
The top section (the name section) contains the name of the class and other general properties (in particular, the stereotype).
The middle section contains a list of attributes
At the bottom is a list of class operations that reflect its behavior (actions performed by the class).
Any of the attribute and operation sections may not be shown (or both). For the missing section, you do not need to draw a dividing line and somehow indicate the presence or absence of elements in it.
Additional sections, such as Exceptions, may be introduced at the discretion of a particular implementation.

Rice. 9. Class Diagram Example
4.4.2.1.Class stereotypes
Class stereotyping is a mechanism for classifying classes into categories.
The UML defines three main class stereotypes:
Boundary (border);
Entity (entity);
Control (management).
4.4.2.2.Boundary classes
Boundary classes are those classes that are located on the boundary of the system and the entire environment. These are displays, reports, interfaces with hardware (such as printers or scanners), and interfaces with other systems.
To find boundary classes, you need to explore use case diagrams. Every interaction between an actor and a use case must have at least one boundary class. It is this class that allows the actor to interact with the system.
4.4.2.3.Entity classes
Entity classes contain stored information. They have the greatest meaning for the user, and therefore their names often use terms from the subject area. Usually, for each entity class, a table is created in the database.
4.4.2.4.Control classes
Control classes are responsible for coordinating the actions of other classes. Typically, each use case has one control class that controls the sequence of events for that use case. The control class is responsible for coordination, but does not carry any functionality in itself, since the other classes do not send it a large number of messages. Instead, he himself sends a lot of messages. The manager class simply delegates responsibility to other classes, which is why it is often referred to as the manager class.
There may be other control classes in the system that are common to several use cases. For example, there might be a SecurityManager class responsible for monitoring security-related events. The TransactionManager class handles the coordination of messages related to database transactions. There may be other managers to deal with other elements of the system's operation, such as resource sharing, distributed data processing, or error handling.
In addition to the stereotypes mentioned above, you can create your own.
4.4.2.5.Attributes
An attribute is a piece of information associated with a class. Attributes store encapsulated class data.
Because the attributes are contained within the class, they are hidden from other classes. Because of this, it may be necessary to specify which classes have the right to read and modify attributes. This property is called attribute visibility.
The attribute can have four possible values for this parameter:
Public (general, open). This visibility value assumes that the attribute will be visible to all other classes. Any class can view or change the value of an attribute. In accordance with UML notation, a common attribute is preceded by a "+" sign.
Private (closed, secret). The corresponding attribute is not visible to any other class. A private attribute is denoted by a "-" sign in accordance with UML notation.
Protected (protected). Such an attribute is available only to the class itself and its descendants. The UML notation for a protected attribute is the "#" character.
Package or Implementation (batch). Assume that the given attribute is shared, but only within its package. This type of visibility is not indicated by any special icon.
With the help of closedness or security, it is possible to avoid the situation when the attribute value is changed by all classes of the system. Instead, the attribute modification logic will be wrapped in the same class as the attribute itself. The visibility options you set will affect the generated code.
4.4.2.6.Operations
Operations implement class-related behavior. An operation has three parts - a name, parameters, and a return type.
Parameters are the arguments that the operation receives as input. The return type refers to the result of the action of the operation.
A class diagram can show both the names of operations and the names of operations along with their parameters and return type. To reduce the load on the diagram, it is useful to show only the names of operations on some of them, and their full signature on others.
In UML, operations have the following notation:
Operation Name (argument: argument data type, argument2: argument2 data type,...): return type
There are four different types of operations to consider:
Implementation operations;
Management operations;
Access operations;
Auxiliary operations.
Implementation operations
Implementor operations implement some business functions. Such operations can be found by examining interaction diagrams. Diagrams of this type focus on business functions, and each message in the diagram can most likely be associated with an implementation operation.
Each implementation operation must be easily traceable to the corresponding requirement. This is achieved at various stages of the simulation. The operation is derived from the message in the interaction diagram, the messages are derived from the detailed description of the flow of events, which is generated based on the use case, and the latter based on the requirements. Being able to trace this entire chain helps ensure that each requirement is implemented in the code, and each piece of code implements some requirement.
Management operations
Manager operations manage the creation and destruction of objects. Class constructors and destructors fall into this category.
Access operations
Attributes are usually private or protected. However, other classes sometimes need to view or change their values. There are access operations for this. This approach makes it possible to safely encapsulate attributes within a class, protecting them from other classes, but still allowing controlled access to them. Creating Get and Set operations (getting and changing a value) for each attribute of a class is a standard.
Auxiliary operations
Auxiliary (helper operations) are those operations of a class that are necessary for it to fulfill its responsibilities, but about which other classes should not know anything. These are private and protected class operations.
To identify transactions, do the following:
1. Study sequence diagrams and cooperative diagrams. Most of the messages in these diagrams are implementation operations. Reflective messages will be auxiliary operations.
2. Consider control operations. You may need to add constructors and destructors.
3. Consider access operations. For each class attribute that other classes will need to work with, you need to create Get and Set operations.
4.4.2.7.Connections
A relationship is a semantic relationship between classes. It gives a class the ability to learn about the attributes, operations, and relationships of another class. In other words, in order for one class to send a message to another in a sequence or cooperative diagram, there must be a connection between them.
There are four types of relationships that can be established between classes: associations, dependencies, aggregations, and generalizations.
Communication association
An association is a semantic relationship between classes. They are drawn on the class diagram as an ordinary line.

Rice. 10. Communication association
Associations can be bidirectional, as in the example, or unidirectional. In the UML, bidirectional associations are drawn as a simple line with no arrows, or with arrows on both sides of the line. A unidirectional association has only one arrow showing its direction.
The direction of an association can be determined by examining sequence diagrams and cooperative diagrams. If all messages on them are sent by only one class and received only by another class, but not vice versa, there is a unidirectional communication between these classes. If at least one message is sent in the opposite direction, the association must be bidirectional.
Associations can be reflexive. Reflexive association means that one instance of a class interacts with other instances of the same class.
Communication addiction
Dependency relationships also reflect the relationship between classes, but they are always unidirectional and show that one class depends on definitions made in another. For example, class A uses methods of class B. Then, when class B changes, it is necessary to make corresponding changes in class A.
A dependency is represented by a dashed line drawn between two diagram elements, and the element anchored at the end of an arrow is said to be dependent on the element anchored at the beginning of that arrow.

Rice. 11. Communication addiction
When generating code for these classes, no new attributes will be added to them. However, the language-specific operators needed to support communication will be created.
Communication aggregation
Aggregations are a tighter form of association. Aggregation is the connection between the whole and its part. For example, you might have a Car class, as well as Engine, Tire classes, and classes for other car parts. As a result, an object of class Car will consist of an object of class Engine, four objects of Tires, etc. Aggregations are visualized as a line with a rhombus for a class that is an integer:

Rice. 11. Communication aggregation
In addition to simple aggregation, the UML introduces a stronger form of aggregation called composition. According to composition, an object-part can only belong to a single whole, and, moreover, as a rule, the life cycle of parts coincides with the cycle of the whole: they live and die with it. Any removal of the whole extends to its parts.
This cascading deletion is often considered part of the definition of aggregation, but it is always implied when the role multiplicity is 1..1; for example, if a Customer needs to be deleted, then that deletion must be propagated to Orders (and, in turn, Order Lines).
The UML is a general-purpose graphical modeling language for the specification, visualization, design, and documentation of all artifacts created in the development of software systems.
There are many good books that describe in detail about UML (sometimes even very detailed), I would like to collect in one place the basic concepts about diagrams, entities and relationships between them for quick recall, something like a cheat sheet.
The note uses materials from books: Ivanov D. Yu., Novikov F. A. Unified modeling language UML and Leonenkov. UML Tutorial.
Let's start with the editor. Under Linux, I tried different UML editors, most of all I liked UMLet, although it is written in Java, it moves very quickly and most of the entity blanks are in it. There is also ArgoUML, a cross-platform UML editor, also written in Java, functionally rich, but slowing down more.
I stopped at UMLet, install it under Arch Linux and ubuntu:
# under Arch Linux yaourt -S umlet # under Ubuntu sudo apt-get install umlet
In UML, all entities can be broken down into the following types:
- structural;
- behavioral;
- grouping;
- annotational;
The UML uses four main types of relationships:
Dependency- indicates that changing the independent entity affects the dependent entity in some way. Graphically, a dependency relationship is depicted as a dotted line with an arrow pointing from the dependent entity to the independent entity.
Association- takes place if one entity is directly related to another (or to others - the association can be not only binary). Graphically, an association is depicted as a solid line with various additions connecting related entities.
Generalization is a relationship between two entities, one of which is a particular (specialized) case of the other. Graphically, generalization is depicted as a line with a triangular unfilled arrow at the end, directed from the particular (subclass) to the general (superclass).
Implementations- the implementation relation indicates that one entity is an implementation of another. Graphically, the implementation is depicted as a dotted line with a triangular unfilled arrow at the end, directed from the implementing entity to the implemented one.
AT UML 2 defined 13 chart types. By standards, each chart should have a frame with a rectangle (lower right corner beveled) in the upper left corner, which indicates the chart ID (tag) and title.
Diagrams to depict the structure of the system:
- Component diagram (component diagram, tag component);
- Deployment diagram (deployment diagram, tag deployment);
- Class diagram (class diagram, tag class);
- Object diagram (object diagram, tag object);
- Internal structure diagram (composite structure diagram, tag class);
Diagrams to depict system behavior:
- Synchronization diagram (interaction diagram, tag timing);
- Activity diagram (activity diagram, tag activity);
- sequence diagram (sequence diagram, tag sd);
- Communication diagram (communication diagram, tag comm);
- Automaton diagram (state machine diagram, tag state machine);
- Interaction overview diagram, tag interaction);
The charts stand out:
- Use case diagram (use case diagram, use case tag);
- Package diagram (package diagram, tag package);
Usage diagram
Usage diagram(use case diagram) is the most general representation of the functional purpose of the system.

Considering a use case diagram as a model of a system, one can associate it with a black box model. Each use case defines a sequence of actions that must be performed by the designed system when it interacts with the corresponding actor.
The use diagram uses two types of basic entities: use cases and actors, between which the following basic types of relationships are established.
association relation- This relationship establishes what specific role an actor plays when interacting with an instance of a use case. An association relationship is indicated by a solid line between the actor and the use case. This line may have additional symbols, such as, for example, a name and a multiplicity.

Extension relation- defines the relationship of instances of a single use case with a more general use case, whose properties are determined based on the way these instances are combined together. Thus, if there is an extension relationship from use case A to use case B, then this means that the properties of an instance of use case B can be supplemented due to the presence of properties in extended use case A.
An extension relationship between use cases is indicated by a dashed line with an arrow (dependency relationship case) pointing away from the use case that is an extension of the original use case.
Generalization relation serves to indicate the fact that some use case A can be generalized to use case B. In this case, use case A will be a specialization of use case B. In this case, B is called an ancestor or parent of A, and use A is a descendant of use case use of V.
Graphically, this relationship is represented by a solid line with an open triangle arrow that points to the parent use case.
A generalization relationship between use cases is used when it is necessary to note that child use cases have all the attributes and behaviors of parent use cases.
Inclusion relation between two use cases indicates that some specified behavior for one use case is included as a component in the behavior sequence of another use case.
An inclusion relationship, from use case A to use case B, indicates that each instance of use case A includes the functional properties specified for use case B.
Graphically, this relationship is represented by a dotted line with an arrow (dependency relationship variant) pointing from the base use case to the included use case.
class diagram
class diagram(class diagram) - the main way to describe the static structure of the system.

The class diagram uses one main type of entities: classes (including numerous special cases of classes: interfaces, primitive types, association classes, etc.), between which the following main types of relationships are established: dependencies, associations, generalizations, implementations.
Dependency relationship generally indicates some semantic relationship between two model elements or two sets of such elements that is not an association, generalization, or implementation relationship. A dependency relationship is used in a situation where some change in one model element may require a change in another dependent model element.
A dependency relationship is graphically represented by a dashed line between corresponding elements with an arrow at one end, with the arrow pointing from the dependency's client class to the independent or source class.

Special keywords (stereotypes) can be placed above the arrow:
- "access" - serves to indicate the availability of public attributes and operations of the source class for client classes;
- "bind" - the client class can use some template for its subsequent parameterization;
- "derive" - attributes of the client class can be calculated from the attributes of the source class;
- "import" - public attributes and operations of the source class become part of the client class, as if they were declared directly in it;
- "refine" - indicates that the client class serves as a refinement of the source class for historical reasons, when additional information becomes available in the course of work on the project.
association relation corresponds to the presence of some relationship between classes. This relationship is indicated by a solid line with additional special symbols that characterize individual properties of a particular association. As additional special characters, the name of the association, as well as the names and multiplicity of the role classes of the association, can be used. The name of an association is an optional element of its designation.

Aggregation relation occurs between several classes if one of the classes is an entity that includes other entities as components. It is used to represent system relationships of the "part-whole" type.

Composition relation is a special case of an aggregation relation. This relationship serves to highlight a special form of the part-whole relationship in which the constituent parts are in some sense within the whole. The specificity of the relationship between them lies in the fact that the parts cannot act in isolation from the whole, i.e., with the destruction of the whole, all its constituent parts are also destroyed.

Generalization relation is a relationship between a more general element (parent or ancestor) and a more specific or special element (child or descendant). As applied to a class diagram, this relationship describes the hierarchical structure of classes and the inheritance of their properties and behavior. This assumes that the descendant class has all the properties and behavior of the ancestor class, and also has its own properties and behavior that are not present in the ancestor class.

automaton diagram
automaton diagram(state machine diagram) or state diagram in UML 1 (state chart diagram) is one way to describe behavior in detail in UML. In essence, automaton diagrams, as the name implies, are a graph of states and transitions of a finite automaton loaded with many additional details and details.
The state diagram describes the process of changing the states of only one class, or rather, one instance of a certain class, that is, it models all possible changes in the state of a particular object. In this case, a change in the state of an object can be caused by external influences from other objects or from the outside. It is to describe the reaction of an object to such external influences that state diagrams are used.

In the automaton diagram, one main type of entity is used - states, and one type of relationship - transitions, but for both of them many varieties, special cases and additional designations are defined. The automaton represents the dynamic aspects of the simulated system in the form of a directed graph, the vertices of which correspond to states, and the arcs correspond to transitions.
Initial state is a special case of a state that does not contain any internal actions (pseudo-states). The object is in this state by default at the initial moment of time. It serves to indicate on the state diagram of the graphical area from which the process of changing states begins.
Final (final) a state is a special case of a state that also does not contain any internal actions (pseudo-states). The object will be in this state by default after the automaton terminates at the end time.

activity diagram
When modeling the behavior of a designed or analyzed system, it becomes necessary not only to present the process of changing its states, but also to detail the features of the algorithmic and logical implementation of the operations performed by the system.
activity diagram(activity diagram) is another way of describing behavior that visually resembles a good old flowchart of an algorithm. Used to simulate the process of performing operations.
The main direction of using activity diagrams is to visualize the features of the implementation of class operations, when it is necessary to present algorithms for their execution.

In the activity diagram, one main type of entities is used - action, and one type of relationship - transitions (transfers of control). Also used are such constructions as forks, mergers, connections, branchings. It is recommended to use a verb with explanatory words as the name of a simple action.
sequence diagram
sequence diagram(sequence diagram) is a way of describing the behavior of the system "by examples".
In fact, a sequence diagram is a record of the protocol of a particular session of the system (or a fragment of such a protocol). In object-oriented programming, the most essential thing at runtime is the passing of messages between cooperating objects. It is the sequence of sending messages that is displayed on this diagram, hence the name.

In the sequence diagram, one main type of entities is used - instances of interacting classifiers (mainly classes, components and actors), and one type of relationship - links through which messages are exchanged.
Possible types of messages (image taken from larin.in):
Communication Diagram
Communication Diagram(communication diagram) - a way of describing behavior, semantically equivalent to a sequence diagram. In fact, this is the same description of the message exchange sequence of interacting instances of classifiers, only expressed by other graphic means.

Thus, in the communication diagram, as well as in the sequence diagram, one main type of entities is used - instances of interacting classifiers and one type of relationship - connections. However, here the emphasis is not on time, but on the structure of relationships between specific instances.
Component Diagram
Component Diagram(component diagram) - shows the relationship between the modules (logical or physical) that make up the simulated system.

The main entity type in a component diagram is the components themselves, as well as interfaces, through which the relationship between components is indicated. The following relationships apply in the component diagram:
- implementations between components and interfaces (the component implements the interface);
- dependencies between components and interfaces (a component uses an interface);
Placement diagram
Placement diagram(deployment diagram), along with displaying the composition and relationships of system elements, shows how they are physically located on computing resources during execution.

In the placement diagram, compared to the component diagram, two types of entities are added: an artifact, which is an implementation of the component and a node (it can be either a classifier that describes the type of node, or a specific instance), as well as an association relationship between nodes, showing that the nodes physically connected at runtime.
Object Diagram
Object Diagram(object diagram) - is an instance of a class diagram.

In the object diagram, one main type of entities is used: objects (class instances), between which specific relationships are indicated (most often association instances). Object diagrams are of an auxiliary nature - in fact, these are examples (one might say, memory dumps) showing what objects exist and the relationships between them at some particular moment in the system's operation.
Diagram of internal structure(composite structure diagram) is used for a more detailed presentation of structural classifiers, primarily classes and components.
A structural classifier is shown as a rectangle with the name of the classifier at the top. Inside are parts. There may be several parts. Parts can interact with each other. This is indicated by connectors of various kinds. The place on the outer edge of the part to which the connector is attached is called the port. Ports are also located on the outer boundary of the structural classifier.
Interaction Overview Diagram(interaction overview diagram) is a kind of activity diagram with an extended syntax: as elements of an overview interaction diagram, links to interactions (interaction use) defined by sequence diagrams can act.
Timing chart
Timing chart(timing diagram) is a special form of a sequence diagram, in which special attention is paid to the change in the states of various instances of classifiers and their time synchronization.
Package diagram
Package diagram(package diagram) is the only tool that allows you to manage the complexity of the model itself.

The main elements of the notation are packages and dependencies with various stereotypes.
Entity-relationship model (ER-model)
analogue class diagrams(UML) can be ER model, which is used in the design of databases (relational model).
Entity-relationship model (ER-model) is a data model that allows you to describe the conceptual schemas of the subject area. The ER model is used in high-level (conceptual) database design. With its help, you can highlight the key entities and designate the relationships that can be established between these entities. wikipedia
Any fragment of the subject area can be represented as a set of entities, between which there are some set of relationships.
Basic concepts:
Essence(entity) is an entity that can be identified in some way that distinguishes it from other entities, for example, CLIENT 777. An entity is actually a set of attributes.
Entity set(entity set) - a set of entities of the same type (having the same properties).
Connection(relationship) is an association established between multiple entities.
Domain(domain) - set of values (domain) of the attribute.
There are three types of binary links:
- one to one- a single instance of an entity of one class is associated with a single instance of an entity of another class, for example, HEAD - DEPARTMENT;
- 1 to N or one to many- a single instance of an entity of one class is associated with many instances of an entity of another class, for example, DEPARTMENT - EMPLOYEE;
- N to M or many to many- many instances of an entity of one class are associated with many instances of an entity of another class, for example, EMPLOYEE - PROJECT; Glossary of basic concepts in UML
- Fowler M. UML. Fundamentals, 3rd Edition
- Butch G., Rambo D., Jacobson I. UML language. User's manual
object- an entity that has a uniqueness and encapsulates the state and behavior.
class- a description of a set of objects with common attributes defining state and operations defining behavior.
interface- a named set of operations that defines a set of services that can be requested by the consumer and provided by the service provider.
Cooperation- a set of objects that interact to achieve some goal.
Actor- an entity that is outside the modeled system and directly interacts with it.
component- a modular part of the system with a well-defined set of required and provided interfaces.
Artifact- an element of information that is used or generated in the software development process. In other words, an artifact is a physical unit of implementation derived from a model element (such as a class or component).
Node- a computing resource on which artifacts are placed and, if necessary, executed.
Behavioral entities are intended to describe behavior. There are only two basic behavioral entities: state and action.
state- a period in the life cycle of an object, being in which the object satisfies a certain condition and performs its own activity or waits for the occurrence of some event.
action- primitive atomic calculation.
Machine is a package that defines a set of concepts necessary to represent the behavior of the modeled entity as a discrete space with a finite number of states and transitions.
classifier is a descriptor for a set of objects of the same type.
Extra reading
UML is an acronym for Unified Modeling Language. In fact, it is one of the most popular business process modeling techniques and is an international standard notation for specifying, visualizing, and documenting software development. Defined by the object management group, it emerged as a result of several additional UML notation systems and has now become the de facto standard for visual modeling. The founding principle of any object-oriented programming starts with model building.
The UML was created out of the chaos around software development and documentation. In the 1990s, there were several different ways of representing software systems. There was a need for a more unified visual UML way of representing these systems, and as a result it was developed between 1994 and 1996 by three software engineers working at Rational Software. It was later adopted as a standard in 1997 and has remained so to this day with only a few updates.
Basically, UML is a general purpose modeling language in the field of software development. However, it has now found its way into the documentation of several business processes or workflows, such as activity diagrams. The UML diagram type can be used as a replacement for flowcharts. They provide both a more standardized way to model workflows and a wide range of features to improve readability and efficiency.

The architecture is based on a meta-object, which defines the basis for the creation of the UML language. It is accurate enough to create an entire application. A fully executable UML can be deployed on multiple platforms using different technologies with all processes throughout the entire software development cycle.
UML is designed for users to develop a visual modeling language. It supports high-level development concepts such as structures, patterns, and collaborations. UML is a collection of elements such as:
- Programming language statements.
- Actors describe the role played by the user or any other system that interacts with the object.
- Activities to be carried out for the execution of the work contract and be presented in diagrams.
- A business process that includes a set of tasks that create a specific service for customers, visualized by a flowchart of sequential actions.
- Logic and reusable software components.
UML diagrams fall into two categories. The first type includes seven types of diagrams representing structural information, the second - the remaining seven representing general types of behavior. These diagrams are used to document the architecture of systems and are directly involved in the UML modeling of the system.

UML diagrams are presented as static and dynamic representations of the system model. The static view includes class and composite structure diagrams that emphasize the static structure. The dynamic view represents the interaction between objects and changes in the internal states of objects using sequence, activity, and state diagrams.
A wide variety of UML modeling tools are available to simplify modeling, including IBM Rose, Rhapsody, MagicDraw, StarUML, ArgoUML, Umbrello, BOUML, PowerDesigner, and Dia.


The use of UML has various forms both in software development documentation and in business processes:
- Sketch. In this case, UML diagrams are used to convey various aspects and characteristics of a system. However, this is only a top-level view of the system and will most likely not include all the necessary details to carry the project through to the very end.
- Forward Design - Sketch design is done before the application is coded. This is done for a better overview of the system or workflow that the user is trying to create. Many design problems or deficiencies can be identified, which will improve the overall health and well-being of the project.
- Reverse design. Once code is written, UML diagrams appear as a form of documentation for various activities, roles, contributors, and workflows.
- Blueprint. In this case, the diagram serves as a complete construct that only requires the actual implementation of the system or software. This is often done using CASE (Computer Aided Software Engineering Tools) tools. The main disadvantage of using CASE tools is that they require a certain level of knowledge, user training, and management and personnel.

UML is not a stand-alone programming language like Java, C++, or Python, however, with the right tools, it can turn into a UML pseudo-programming language. To achieve this goal, the entire system must be documented in different diagrams, and using the right software, the diagrams can be directly translated into code. This method can only be useful if the time spent drawing diagrams takes less time than writing the actual code. Even though UML was created for system modeling, it has found several uses in business areas.
The following is an example of a UML diagram for business modeling.

One practical solution would be to visually represent the process flow for telesales through an activity diagram. From the moment when the order is taken as an input, until the moment when the order is completed and a specific output is given.
There are several types of UML diagrams, and each of them performs a different task, whether it is developed before implementation or after, as part of the documentation. The two broadest categories covering all other types are the behavior diagram and the structure diagram. As the name suggests, some UML diagrams attempt to analyze and depict the structure of a system or process, while others describe the behavior of the system, its participants, and components.
The different types are broken down as follows:
- Not all of the 14 different types of UML diagrams are used on a regular basis when documenting systems and architectures.
- The Pareto principle also applies to the use of UML diagrams.
- 20% of diagrams are used by developers 80% of the time.
The most commonly used elements in software development are:
- usage diagrams;
- class diagrams;
- sequences.

Activity Diagrams - The most important UML diagrams for creating business process models. In software development, they are used to describe the flow of various activities. They can be either serial or parallel. They describe the objects used, consumed or produced by an activity and the relationship between different activities.
All of the above is essential for modeling business processes that lead from one to another, as they are interconnected with a clear beginning and end. In a business environment, this is also referred to as business process mapping. The main actors are the author, editor and publisher. An example of UML is the following. When a reviewer reviews a project and decides that some changes need to be made. The author then reviews the draft and returns it again to analyze the review.
Usage diagram
The cornerstone of the system - used to analyze the requirements for the system level. These requirements are expressed in different use cases. The three main components of a UML diagram are:
- Functional - presented as use cases.
- A verb that describes an action.
- Actors - to interact with the system. Actors can be users, organizations, or an external claim. Relationships between participants are represented by straight arrows.
For example, for the stock management diagram. In this case, there is an owner, a supplier, a manager, an inventory specialist, and an inventory inspector. The round containers represent the actions that the actors perform. Possible actions: buy and pay for shares, check the quality of stocks, return stocks or distribute stocks.
This type of diagram is well suited for showing the dynamic behavior between participants in a system, making it easier to represent without showing implementation details.
Temporary
UML timing diagrams are used to represent object relationships when the focus is time dependent. In this case, it is not interesting how objects interact or change each other, but the user wants to imagine how objects and subjects act along a linear time axis.
Each individual participant is represented through a lifeline, which is essentially a line forming stages as an individual participant moves from one stage to another. The main attention is paid to the duration of the time of events and the changes that occur depending on it.
The main components of a timing diagram are:
- Lifeline is an individual member.
- State timeline - the only life path can go through different states within a process.
- Duration constraint - a time interval constraint that represents the duration of the constraint required to fulfill.
- Time Limit - Limiting the time interval during which something must be performed by a member.
- Destruction Emergence - The appearance of a message that destroys an individual member and depicts the end of that member's life cycle.

Horizontal diagrams, also called statecharts, are used to describe the various states of a component within a system. It takes the final name format because the diagram is essentially a machine that describes the multiple states of an object and how it changes based on internal and external events.
A very simple machine state diagram would be in a chess game. A typical chess game consists of moves made by White and moves made by Black. White has the first move, thus initiating the game. The end of the game can take place regardless of whether White or Black wins. The game can end in a match, resignation, or a draw (different states of the car). Statecharts are used mainly in forward and reverse UML design of various systems.
Sequential
This type of diagram is the most important UML diagram not only among the computer science community, but also as design-level models for developing business applications. They are popular in describing business processes due to their visually self-explanatory nature. As the name suggests, diagrams describe the sequence of messages and interactions that take place between subjects and objects. Actors or objects can only be active when necessary or when another object wants to communicate with them. All communications are presented in chronological order.
For more information, please see the UML Sequence Diagram example below.

As follows from the example, structural diagrams are used to show the structure of a system. More specifically, language is used in software development to represent the architecture of a system and how different components are related.

The UML class diagram is the most common type of diagram for software documentation. Since most of the software being created today is still based on the object-oriented programming paradigm, using class diagrams to document software is common sense. This is because OOP is based on UML classes and the relationships between them. In a nutshell, charts contain classes, along with their attributes, also called data fields, and their behaviors, called member functions.
More specifically, each class has 3 fields: name at the top, attributes right below the name, operations/behavior at the bottom. The relationship between different classes (represented by a connecting line) makes up a class diagram. The example above shows a basic class diagram.
Objects
When discussing UML structure diagrams, you need to delve into concepts related to computer science. In software engineering, classes are considered as abstract data types while objects are instances. For example, if there is "Car" which is a generic abstract type, then the instance of the class "Car" would be "Audi".
UML object diagrams help software developers to check whether the generated abstract structure is a viable structure when implemented in practice, that is, when objects are created. Some developers consider this a secondary level of accuracy checking. It displays class instances. More precisely, the generic class "Client" now has an actual client, for example named "James". James is an instance of a more general class and has the same attributes, however, with given values. The same was done with the Accounts and Savings account. They are both objects of their respective classes.
Deployments
Deployment diagrams are used to visualize the relationship between software and hardware. To be more specific, with deployment diagrams, one can build a physical model of how software components (artifacts) are deployed to hardware components known as nodes.
A typical simplified deployment scheme for a web application would include:
- Nodes (application server and database server).
- Artifacts diagram of the client application and database.
The package diagram is similar to the macros for the deployment UML diagrams we explained above. Various packages contain nodes and artifacts. They group diagrams and model components into groups, much like a namespace encapsulates different names that are somewhat related. Ultimately, the package can also be created by several other packages to represent more complex systems and behaviors.
The main purpose of a package diagram is to show the relationships between the various large components that make up a complex system. Programmers find this abstraction to be a good advantage for using package diagrams, especially when some details can be left out of the picture.

Like any other thing in life, in order to do something right, you need the right tools. To document software, processes or systems, use tools that offer UML annotations and diagram templates. There are various software documentation tools that can help draw the diagram.
They generally fall into the following main categories:
- Paper and pen is easy. Grab paper and pen, open up UML syntax code from the web, and draw whatever type of diagram you want.
- Online Tools - There are several online applications that can be used to create a chart. Most of them offer a paid subscription or a limited number of diagrams in the free tier.
- Free online tools are almost the same as paid ones. The main difference is that paid ones also offer tutorials and ready-made templates for specific diagrams.
- Desktop Application - The typical desktop application to use for diagrams and just about any other diagram is Microsoft Visio. It offers advanced features and functionality. The only downside is that you have to pay for it.
Thus, it is clear that the UML is an important aspect associated with the development of object-oriented software. It uses graphical notation to create visual models of system programs.
UML diagram is a specialized graphical description language designed for object modeling in the development of various software. This language has a broad profile and is an open standard that uses various graphical notations to create an abstract model of a system. The UML was created to enable the definition, visualization, documentation, and design of all kinds of software systems. It is worth noting that the UML diagram itself is not a programming language, but it provides for the possibility of generating a separate code based on it.
Why is she needed?
The use of UML does not end with modeling all sorts of software. Also, this language is actively used today for modeling various business processes, conducting system design, as well as displaying organizational structures.
With the help of UML, software developers can ensure full agreement in the graphical notation used to represent common concepts such as: component, generalization, class, behavior, and aggregation. This achieves a greater degree of concentration on architecture and design.
It is also worth noting that there are several types of such charts.
class diagram
A UML class diagram is a static structure diagram designed to describe the structure of a system, as well as show the attributes, methods, and dependencies between several different classes.
It is worth noting the fact that there are several points of view on the construction of such diagrams, depending on how they will be used:
- Conceptual. In this case, the UML class diagram describes the model of a specific subject area, and it provides only classes of application objects.
- Specific. The diagram is used in the process of designing various information systems.
- Implementation. The class diagram includes all kinds of classes that are directly used in the program code.
Component Diagram

The UML component diagram is a completely static structure diagram. It is intended to demonstrate the breakdown of a particular software system into various structural components, as well as the relationships between them. A UML component diagram can use all sorts of models, libraries, files, packages, executables, and many other elements as such.
Composite/composite structure diagram
The UML composite/composite structure diagram is also a static structure diagram, but it is used to show the internal structure of classes. If possible, this diagram can also demonstrate the interaction of elements that are in the internal structure of the class.
A subspecies of these is the UML collaboration diagram, which is used to demonstrate the roles and interactions of different classes within the scope of a collaboration. They are quite handy if you need to model design patterns.
It is worth noting that UML class diagrams and composite structure diagrams can be used at the same time.
Deployment Diagram

This diagram is used to model running nodes, as well as all kinds of artifacts that have been deployed on them. In UML 2, artifacts are deployed at various nodes, while in the first version only components were deployed. Thus, the UML deployment diagram is used primarily for the second version.
A manifestation dependency is formed between an artifact and the component it implements.
Object Diagram
This view allows you to see a full or partial snapshot of the system being created at a certain point in time. It fully displays all instances of the classes of a particular system, indicating the current values of their parameters, as well as the relationships between them.
Package diagram

This diagram is structural in nature, and its main content is all kinds of packages, as well as the relationships between them. In this case, there is no strict separation between several structural diagrams, as a result of which their use is most often used solely for convenience, and does not carry any semantic meaning. It is worth noting that different elements may provide other UML diagrams (examples: packages and package diagrams themselves).
Their use is carried out in order to ensure the organization of several elements into groups according to a certain attribute, in order to simplify the structure, as well as to organize work with the model of this system.
activity diagram

The UML activity diagram displays the decomposition of a particular activity into several component parts. In this case, the concept of "activity" refers to the specification of a certain executable behavior in the form of parallel, as well as coordinated sequential execution of various subordinate elements - nested types of activities and various actions, united by flows going from the outputs of a certain node to the inputs of another.
The UML activity diagram is often used to model various business processes, parallel and sequential computing. Among other things, they model all kinds of technological procedures.
automaton diagram
This view is called and somewhat differently - the UML state diagram. It has a presented state machine with simple and composite states, as well as transitions.
A finite state machine is a specification of a sequence of different states through which a certain object passes, or an interaction in response to some events in its life, as well as the response of an object to such events. The state machine that the UML state diagram uses is attached to the original element and used to define the behavior of its instances.
So-called dragon diagrams can be used as analogues of such diagrams.
Use Case Diagrams

The UML Use Case Diagram displays all the relationships that occur between the actors, as well as the different use cases. Its main task is to provide a full-fledged means by which the customer, end user, or some developer can jointly discuss the behavior and functionality of a particular system.
If a UML use case diagram is used in a system modeling process, then the analyst is going to:
- Clearly separate the system being modeled from its environment.
- Identify actors, ways of their interaction with this system, as well as its expected functionality.
- Set in the glossary as a subject area various concepts that relate to a detailed description of the functionality of this system.
If a usage diagram is being developed in the UML, the procedure begins with a textual description, which is obtained when working with the customer. At the same time, it is worth noting the fact that various non-functional requirements are completely omitted in the process of compiling the use case model, and a separate document will already be formed for them.
Communications
The communication diagram, just like the UML sequence diagram, is transitive, that is, it expresses the interaction, but at the same time it demonstrates it in different ways, and if necessary, with the required degree of accuracy, one can be transformed into another.
The communication diagram reflects the interactions that occur between the various elements of the composite structure, as well as the roles of cooperation. Its main difference from the sequence diagram is that it clearly indicates the relationship between several elements, and time is not used as a separate dimension.
This type is distinguished by an absolutely free format of ordering several objects and relationships in the same way as it is done in an object diagram. If there is a need to maintain the order of messages in this free format, they are numbered chronologically. The reading of this diagram begins with the initial message 1.0, and subsequently continues in the direction in which messages are transmitted from one object to another.
For the most part, such diagrams show exactly the same information that a sequence diagram provides us, but because it uses a different way of presenting information, certain things in one diagram become much easier to determine than in another. It is also worth noting that a communication diagram more clearly shows which elements each individual element interacts with, while a sequence diagram more clearly shows in what order interactions are carried out.
sequence diagram

The UML sequence diagram shows the interactions between several objects, which are ordered according to the time of their occurrence. Such a diagram shows a time-ordered interaction between several objects. In particular, it displays all the objects that take part in the interaction, as well as the complete sequence of messages exchanged by them.
The main elements in this case are the designations of various objects, as well as vertical lines that display the passage of time and rectangles that represent the activity of a particular object or the performance of some function by it.
Cooperation diagram
This type of diagram allows you to show the interactions between several objects, abstracting from the sequence of message translation. This type of diagrams in a compact form displays absolutely all transmitted and received messages of a certain object, as well as the formats of these messages.
Because sequence diagrams and communication diagrams are simply different views of the same procedures, Rational Rose provides the ability to create a communication sequence diagram from a sequence diagram or vice versa, and also synchronizes them completely automatically.
Interaction Overview Diagrams
These are UML diagrams, which belong to a type of activity diagrams and include both Sequence elements and control flow constructs.
It is worth noting the fact that this format combines Collaboration and Sequence diagram, which provide an opportunity to consider the interaction between several objects in the system being formed from different points of view.
Timing chart
Represents an alternative version of the sequence diagram, which explicitly demonstrates the change in state on the lifeline with a certain time scale. It can be quite useful in various real-time applications.
What are the benefits?
It is worth noting several advantages that distinguish the UML usage diagram and others:
- The language is object-oriented, as a result of which the technologies for describing the results of the analysis and design carried out are semantically close to programming methods in all kinds of object-oriented languages of the modern type.
- Using this language, the system can be described from almost any possible point of view, and various aspects of its behavior are described in the same way.
- All diagrams are relatively easy to read even after a relatively quick familiarization with its syntax.
- UML allows you to expand, as well as introduce your own graphic and text stereotypes, which contributes to its use not only in software engineering.
- The language has become quite widespread, and is also quite actively developing.
Flaws
Despite the fact that the construction of UML diagrams has a lot of its advantages, they are often criticized for the following shortcomings:
- redundancy. In the vast majority of cases, critics say that the UML is too big and complex, and often this is unjustified. It includes quite a lot of redundant or almost useless constructions and diagrams, and most often such criticism goes to the second version, and not the first, because in newer revisions there are more “committee-designed” compromises.
- Various inaccuracies in semantics. Because UML is defined by a combination of itself, English, and OCL, it lacks the stiffness that is inherent in languages that are precisely defined by formal description techniques. In certain situations, the abstract syntax of OCL, UML, and English begin to contradict each other, while in other cases they are incomplete. The inaccuracy of the description of the language itself affects both users and tool providers alike, eventually leading to tool incompatibilities due to the unique way different specifications are treated.
- Problems in the process of implementation and study. All of the above problems create certain difficulties in the process of implementing and learning UML, and this is especially true when management forces engineers to use it when they lack prior skills.
- The code reflects the code. Another opinion is that it is not beautiful and attractive models that are important, but directly working systems, that is, the code is the project. According to this view, there is a need to develop a more efficient way to write software. UML is valued in approaches that compile models to regenerate executable or source code. But in reality, this may not be enough, because the language lacks Turing completeness properties, and each generated code will eventually be limited by what the UML interpreting tool can assume or determine.
- Load mismatch. This term comes from the theory of systems analysis to determine the inability of the input of a certain system to perceive the output of another. As with any standard notation, the UML can represent certain systems in a more efficient and concise way than others. Thus, the developer is more inclined towards those solutions that are more comfortable for weaving all the strengths of the UML, as well as other programming languages. This problem is more obvious if the development language does not conform to the main principles of the object-oriented orthodox doctrine, that is, does not try to work in accordance with the principles of OOP.
- Tries to be versatile. UML is a general-purpose modeling language that seeks to be compatible with any processing language currently in existence. In the context of a particular project, in order for the design team to achieve the final goal, it is necessary to choose the applicable features of this language. In addition, possible ways to limit the scope of the use of UML in any particular area go through a formalism that is not fully formulated, but which itself is the object of criticism.
Thus, the use of this language is not relevant in all situations.