Performance counters. Part 1
The performance of a computer is determined by the speed at which the computer performs the assigned tasks. Many factors affect the overall performance of the system - the processing power of the processor, the amount of available RAM, the speed disk subsystem, bandwidth of network interfaces, etc.
Sometimes, when performance is insufficient, it may be necessary to analyze the situation and track the use of resources by applications or system processes in order to then increase the capacity of the system in accordance with increasing demands.
One of the most powerful tools for detecting performance problems in Windows is the built-in Performance Counters. They will be discussed in this article.
The main tool for managing performance counters in Windows is the Performance Monitor snap-in, in earlier Windows versions known as System Monitor. Performance Monitor has several display modes and allows you to display performance counters in real time, as well as save data to log files for later study.
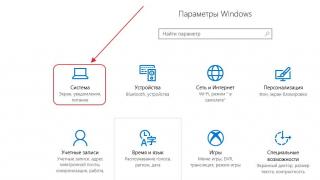
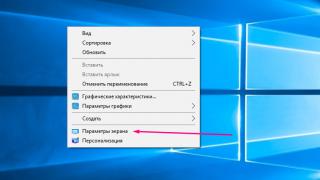
You can find Performance Monitor in the Start menu ( start screen in Server 2012) under Administrative tools, or by clicking Win + R and in the "Run" window execute the command perfmon.msc... It should be borne in mind that not all users are authorized to use this snap-in. In addition to members of the Administrators group, who have full rights and can use all its capabilities, there are two more groups:
Performance Monitor Users - Can view (locally or remotely) performance monitor data and modify display properties in real time. Do not have permission to create or modify Data Collector Set;
Performance Log Users - Have all the rights of the previous group and can create and modify data collector groups.
Well, ordinary users belonging to the Users group can only open log files for viewing in the performance monitor.
Important. In accordance with the requirement of the instrumentation Windows management(WMI), the Performance Log Users group must be granted the right to log on as a batch job. To do this, you need to open the snap local policy Security (secpol.msc), under "Local policies \ User Rights Assignment" find the setting Log on as batch job and add the Performance Log Users group to the list .
Adding counters
So, the first thing we do, opening Performance Monitor, is adding the counters we need to the monitoring window. By default, the window already displays one counter showing total load processor. You can delete an unnecessary counter by selecting it and clicking on the red cross on the toolbar, or by pressing Delete... To add counters, press the green button or Ctrl + N.

The window for adding counters opens. In the "Select counters from computer" field, set the name or IP address of the computer to be monitored. By the way, Performance Monitor can display counters from different computers in one window.
Then we select performance counters from the list. All counters are combined into groups, usually containing the name of the performance object in their name. For example, to monitor network activity open a group Network interface and select counters that show the amount of received and transmitted network traffic, the total amount of traffic and the current bandwidth.
If you are in doubt about the purpose of a meter, then there is an opportunity to look at its description. To do this, check the "Show description" checkbox in the lower left corner. The description is not very detailed, but informative enough.
Note. The number of performance counters is quite large and depends on the version of the operating system and the installed server roles and components. So, for example, in Windows Server 2012 added a large number of meters designed for monitoring virtual machines... Additionally, some server products such as Exchange or SQL Server add their own counters to the system.
After selecting the monitoring object and highlighting the required counters, in the "Instances of selected object" field, select the instance (Instance) of the object. So choosing as an object network interfaces, here we indicate which one should be monitored. You can select one or more instances by selecting All Instance we will display the data for each instance separately, and the value _Total will print the average value over all instances of the object.

This is what the performance monitor window looks like after adding counters. By default, performance counter values are displayed as a line graph. Having selected a specific counter, you can see in the panel the current (last), minimum (minimum), maximum (maximum) and average (average) values for the specified time period.
If a large number of meters are used at the same time, it can be difficult to keep track of each of them. Therefore, if necessary, it is better to hide unnecessary counters, for which it is enough to uncheck the box in the Show column.
By clicking the corresponding button on the toolbar, you can select the display mode in the form of a histogram (Histogram bar) or in the form of a report (Report). You can also switch between modes with a keyboard shortcut Ctrl + G.

For example, if you need to constantly monitor the current values of the counters, then the report mode is more visual.

Alternatively, you can highlight a specific counter so that it is reflected in a thicker line. To do this, select the desired counter and click on the Highlight button located in the toolbar. You can also use the keyboard shortcut to select Ctrl + H.

Performance Monitor setup
Performance Monitor has many settings designed to best display your data. You can open the performance monitor settings dialog box by clicking on it right key mouse and selecting Properties, either by clicking on an inconspicuous button in the toolbar, or by clicking Ctrl + Q.

On the General tab, you can:
Display Elements - remove \ add elements displayed in the Performance Monitor window;
Report and Histogramm Data - change the values displayed in the report and histogram mode. By default, they display the current values of the counters. You can specify the minimum, maximum or average value, and the displayed data will be recalculated each time;
Sample Automaticaly - automatic data collection. By default, data sampling is performed automatically at a specified interval. By removing the checkbox, we will thus enable the manual mode, in which the data is removed by the Update Data button on the toolbar, or by a keyboard shortcut Ctrl + U... Also switch from manual mode to automatic and back, you can use the keys Ctrl + F;
Graph elements - chart elements. The Sample Every field sets the data update interval in automatic mode, and in the Duration field - the time interval displayed in the Performance Monitor window. By default, data is refreshed every second and the displayed interval is 100 seconds. For more or less long-term observation, it is advisable to increase these values.

On the Source tab, we indicate where to get the data from:
Current activity - the current activity, displayed in the Performance Monitor window by default;
Log files - here you can specify the path to the previously saved log file;
Database - use the base as a source SQL data... Performance Monitor allows you to write and retrieve performance data into the database, of course, if you have a SQL server.

On the Data tab, you can edit the list of counters, as well as change the visual parameters of the display of each counter - color (Color), scale (Scale), line width (Width) and its style (Style).

On the Graph tab, change the display of the graph:
View - set the display mode: graph, histogram or report;
Scroll style is a scroll type that indicates the direction of scrolling for a line chart. Selecting Wrap will scroll the chart from left to right, Scroll in the opposite direction;
Title - the name of the chart displayed under the toolbar;
Vertical axis - using this parameter you can name the vertical coordinate axis;
Show - turns on the display of vertical and horizontal grids and labels with values for the coordinate axes;
Vertical scale - the range of values of the vertical scale. Here we set the minimum and maximum values that will be displayed on the chart.

Well, on the Appearance tab, you can customize the color scheme and the font used.

Saving performance data
Sometimes it may be necessary to save the acquired data, for example, to provide a report or for further analysis. Performance Monitor allows you to export the resulting data to a file. To export, right-click in the window and select "Save Settings As" in the menu that opens. By default, the report is saved in HTML format and it can be opened in any browser.
You can also choose to save the file format with the extension .tsv - tab-delimited file. This format can be used to export data to spreadsheets. And by selecting the "Save Image As" item in the context menu, you can save the screen contents as an image in GIF format.

This is how an HTML report looks in a browser. It contains all the parameters of the performance monitor, including the display type, titles, etc.

PowerShell
Performance counter values can also be viewed from the PowerShell console, where there is a special Get-Counter cmdlet for this. Although PowerShell has much fewer options for displaying performance counters than Performance Monitor, it can be used in setup mode. Server Core, at complete absence graphical interface.
Suppose we want to use it to see the processor load. First, let's display all the available counters for the processor:
(Get-Counter -ListSet Processor) .counter
Then we select the desired one and display its value:
Get-Counter -Counter ″ \ Processor (_total) \% Processor Time ″ -SampleInterval 10 -MaxSamples 2
The counter instance (Instance) is indicated in brackets, in this example these are the processor cores. You can specify the number a specific instance, or put an asterisk (*), then information on each instance will be displayed, and by specifying the (_total) parameter, we will get the summary information for all instances.
- The -SampleInterval parameter specifies the frequency of data collection, and -MaxSamples - the number of attempts. So in the example, the data is taken 2 times with an interval of 10 seconds. If you specify -Continuous instead of these parameters, then the data will be taken continuously until you press Ctrl + C;
-
If necessary, you can display values from several counters, specifying them separated by commas.

Conclusion
So today we looked at some of the ways to use performance counters to monitor servers in real time. V it will be about setting up data collector groups, saving data to log files and then analyzing it, and setting up notifications.
Acquaintance with monitoring systems.
Consider monitoring tools: Performance Console and Network Monitor
Performance Console.
To launch the Performance console, open the Administrative Tools folder in the Control Panel and select the Performance.
The Performance Console is actually two tools:
- snap system monitor,
- The Performance Logs and Alerts stand-alone snap-in — for viewing monitoring log files.

System Monitor snap-in.
Using the Performance Monitor snap-in, you can measure the performance of your computer or other computers on the network:
- Collect and view current system performance data on local computer or on multiple remote computers.
- View current data or data previously collected using the Performance Logs and Alerts snap-in.
- Present data as a graph, bar graph, or report that can be printed.
- Implement Performance Monitor capabilities in Microsoft Word or other applications Microsoft package Office using OLE Automation.
- Create HTML pages for performance preview.
- Create monitoring configurations that allow reuse that can be installed on other computers using the MS Management Console
Objects and performance counters.
Windows XP obtains performance information from computer components. System components generate performance data during their operation. Such components are called performance objects.
There are a number of performance objects in the OS, usually corresponding to the main hardware components such as memory, processors, and so on. Applications can also install their own performance objects.
Each performance object provides counters that collect performance data. For example, the page swaps / sec counter of the Memory object tracks the page caching rate.
Objects that are most commonly used to track work system components:
- logical drive;
- physical disk;
- memory;
- flow;
- process;
- CPU;
- system;
- swap file;
In Windows XP, the object Physical disk is enabled by default, and the object Logical disk disabled by default. To enable counters for monitoring logical drives or volumes, you need to run the command in the console diskperf -yv and reboot the system.
For an explanation of what data a particular counter provides, click the Explain button in the Add Counters dialog box, which can be accessed by clicking the plus sign in the snap-in toolbar.

Some objects (such as Memory and Server) have only one instance, although other performance objects can have multiple instances. If an object has many instances, then you can add counters to track statistics for each instance or for all instances at the same time.
For example, if several processors are installed in the system, then the object CPU will have multiple instances. Moreover, if an object supports multiple instances, then when the instances are grouped together, there will be a parent instance and child instances that will belong to that parent instance.
Setting up counters.
When you select the System Monitor snap-in in the results pane, a window for plotting graphs will open by default. Steps to add counters:
If you do not have the appropriate permissions to monitor your computer, an error message will appear. The counter will be displayed on the bar graph, but no data will be displayed.
If there is no counter on the screen that you are going to monitor, it is possible that the service or element that is the counter object is not installed or not activated on this computer and you should add this service first.
You can put the System Monitor control in Microsoft document Word. For this:
- Open up Word document and position the cursor where you want the control to be placed.
- From the View menu, select Toolbars -> Controls.
- Click the More Items button and select the System Monitor Control option from the list.
- The System Monitor graph will be inserted into specified place in the document. V this moment the item is in design mode, so you can work with it in the Visual Basic Editor.
- To change settings or add counters, click the Exit Design Mode button to exit design mode.
- To add counters to the graph, click on it right click mouse and select Add counters from the context menu.
Customization appearance.
There are three performance information viewers available in the Performance Monitor snap-in: two graphical (Graph and Bar Graph) and one textual (Report). To customize the appearance of the monitoring window, right-click the graph and select Properties from the context menu. In the window that opens for the graph and histogram, you can set a series additional parameters display:
- name of the graph or histogram and coordinate axes;
- range of values output;
- characteristics of a curve in a graph or bars in a histogram, such as color, thickness, style, etc.
In the tab Are common you can specify the required type of monitoring tool. The option is selected by default. Schedule... You can also display performance data as a bar chart or report.
Working with the System Monitor snap-in.
As you monitor your system, keep in mind a few helpful rules to help you make the most of your system's resources:
- Determine the configuration of the monitoring tools. To track work Windows installations XP, you can view the data as a graph using Performance Monitor, or collect data in performance logs for viewing and analysis in other applications. Configure the Performance Alerts and Logs snap-in to collect data from selected counters at specific intervals. The resulting data logs can be used to generate reports and analyze overall system performance, and plan future upgrades.
- Keep the resources required for monitoring low. Monitoring tools are configured to consume a minimum amount of resources. However, in some cases, additional measures are required to reduce it. The presentation of performance data in the Performance Monitor window in the form of a graph, frequent data sampling, a large number of monitored objects and counters - all this increases the amount of resources spent on performance monitoring.
- Analyze performance data and determine a performance baseline. It is generally helpful to establish a baseline performance level for a typical workload. This can be done by outputting data to graphically in the System Monitor window.
- Setting alerts. Set to generate alerts when counter values exceed acceptable values.
- Performance tuning. Use performance data to tune system settings for optimal handling of the system load.
- Planning. Monitor server load trends and the need for system hardware upgrades.
Choosing a monitoring method.
It is convenient to use graphs for ongoing monitoring of the system operation in real time on a local or remote computer. Logs in the Performance Logs and Alerts snap-in are useful for logging entries. The logged data can be used to create reports and presented as graphs or histograms using System Monitor.
Selecting the registration frequency.
Care should be taken when choosing the frequency and duration of data logging, as frequent updates data leads to the generation of a very large amount of data, which will be difficult to work with. It can also increase the performance overhead for running the Performance Logs and Alerts snap-in.
V general case the data refresh rate depends on the length of the logging interval. If the registration interval is 4 hours, then it is recommended to install the update every 15 seconds. For an 8 hour registration interval, select an update period of at least 300 seconds (5 minutes). In general, for continuous monitoring, the interval is set to 15 minutes.
The choice of counters.
Monitoring should begin by tracking the following four components in order:
- Memory.
- Processors.
- Disks.
- Net.
The table below shows minimal set counters to use to monitor the server. In the process, you can add additional counters for the performance objects of interest.
Component | The investigated parameter | Counters |
Select a computer to be used for monitoring.
When monitoring remote computers several options for data collection are possible. For example, you can run Performance Logs and Alerts on an administrative computer and display data from all remote computers. Alternatively, you can run the data collection service on each computer and run at regular intervals batch program to transfer data to the administrator's computer for subsequent analysis and archiving.
Centralized data collection (collecting data from all remote computers on a local computer) is the easiest to implement. Collecting data from multiple systems can be logged into a single log file, but this increases the network traffic and more memory is required on the administrator's computer.
Distributed data collection (that is, data collection that occurs on each monitored computer) does not increase traffic and does not require additional memory on the administrator computer. However, in this case, the transfer of data to the administrator's computer will be made with a certain delay.
Analyze performance data.
The analysis of monitoring results includes checking the meter readings recorded during the execution of various operations by the system. During this process, you should determine the most active processes, as well as to identify programs or threads that exclusively use any resources. As a result, you must figure out how your system is handling the workload.
During this analysis, you should determine the level of performance of the system when a typical load is being processed and all are running. required services which is called baseline... The base standard is determined by the administrator based on the workload. This level is determined from a number of performance counters and is the state of the system when it satisfactorily handles all user requests.
Determination of acceptable meter readings.
In general, determining an acceptable level of performance is a rather subjective decision. However, the table below shows limit values for a range of meters to help you determine if the meter readings indicate a problem. If the meter readings are stably kept at the maximum level, then there is every reason to talk about the presence of a bottleneck in the system, and measures should be taken to configure or modernize the loaded resource.
Limit readings of counters:
Object \ counter | Limit level |
Performance Monitor allows you to confirm suspicions of a problem on a user's system or on a network server. For example, you may suspect that the resulting slowdown in the system is due to insufficient RAM installed on the computer.
To confirm this hypothesis, you can use the System Monitor to count the number of memory pages that are paged out on HDD in one second of system operation time. Too many pages being swapped out per second to the hard drive indicates that there is not enough RAM on the system.
The most common bottlenecks that affect system performance are shown in the table below. The table contains a description of the System Monitor counters that are most commonly used to identify system abnormalities.
For each counter, the table lists the threshold recommended by Microsoft. If the memory threshold is exceeded, then it's time to increase the amount of RAM installed on your computer. If the network threshold is exceeded, then it is worth considering additional segmentation of the local subnet adjacent to the system. If the drive threshold is exceeded, a faster hard drive is required.
In this case, you can choose between replacing IDE drives with drives with SCSI interface or implementation hardware solution RAID, such as RAID level 0 (striped volumes). Usually, when the threshold for a processor is exceeded, you need to think about replacing the processor with a faster one.
If the system is running many multithreaded programs, then it is worth considering using a multicore or multiprocessor computer.
Common system performance bottlenecks
|
Limit value |
||
|
Bytes sent Pages / sec |
Less physical RAM |
|
|
Total byte / sec |
The sum of all systems involved in the problem must be less than the available one throughput networks (example: 100Mb / s) |
|
|
Physical disk |
Average baud rate / sec Disk queue length % disk time |
|
|
CPU |
% cpu time Processor queue length |
System Monitor can be opened by choosing the command Start> All Programs> Administrative Tools> Performance (Start> All Programs> Administrative Tools> Performance)... Another way to launch System Monitor is to select the command Start> Run, command input perfmon in the dialog box Run and click on the button OK.
As soon as the System Monitor window opens, you will notice that the three most popular counters are automatically open: Pages / sec, Disk queue length and % cpu time.
For example, it may be that it is worth paying attention to the average number of Pages / sec parameter. Let's say it's 47.593. This is significantly higher than the threshold of 20. In this case, it is a bottleneck for system performance, since the Windows operating system is running on a computer with 128 MB of RAM installed.
For adding additional counters you need to perform the following actions:
1. Right-click anywhere in the display area System Monitor and select Add Counters(or click on the + icon in the toolbar).
In the previous article, I compiled a list of 80 monitoring tools Linux systems... It also made sense to make a selection of tools for the Windows system. Below is a list that serves only as a starting point, there is no rating here.
1. Task Manager

The well-known Windows Task Manager is a utility for displaying a list running processes and the resources they consume. But do you know how to use its full potential? As a rule, it is used to monitor the state of the processor and memory, but you can go much further. This app is pre-loaded on all operating systems Microsoft.
2. Resource Monitor
A great tool to estimate CPU, RAM, network and disk usage in Windows. It allows you to quickly get all necessary information the status of critical servers.

3. Performance Monitor

The main tool for managing Windows performance counters. Performance Monitor, more early versions Windows is known to us as the System Monitor. The utility has several display modes, displays performance counters in real time, saves data to log files for later study.
4.Reliability Monitor

Reliability Monitor - System stability monitor, allows you to track any changes in computer performance, you can find the stability monitor in Windows 7, in Windows 8: Control Panel> System and Security> Action Center. With the help of Reliability Monitor, you can keep a record of changes and failures on the computer, the data will be displayed in a convenient graphical form, which will allow you to track which application and when caused an error or hang, track the appearance blue screen Windows death, the reason for its appearance (another Windows update or installing the program).
5. Microsoft SysInternals

SysInternals is full set programs for administration and monitoring of computers running Windows. You can download them yourself for free on the Microsoft website. Service Sysinternals programs help you manage, troubleshoot, and diagnose applications and operating Windows systems.
6. SCOM (part of Microsoft System Center)

System Center is a complete set of tools for IT infrastructure management, with which you can manage, deploy, monitor, configure Microsoft software (Windows, IIS, SQLServer, Exchange, and so on). Alas, MSC is not free. SCOM is used for proactive monitoring of key IT infrastructure assets.
Monitoring Windows Servers with the Nagios Family
7. Nagios

Nagios has been the most popular infrastructure monitoring tool for several years (for Linux and Windows). If you are considering Nagios for Windows, then install and configure the agent to Windows Server... NSClient ++ monitors the system in real time and provides outputs from remote server monitoring and not only.
8. Cacti

Usually used in conjunction with Nagios, it provides the user with a convenient web interface to the RRDTool utility designed to work with Round Robin Databases, which are used to store information about changes in one or more values over a certain period of time. Statistics in network devices is presented in the form of a tree, the structure of which is set by the user himself, you can build a graph of channel use, use of HDD partitions, display resource latency, etc.
9. Shinken

Flexible, scalable open source monitoring system based on the Nagios core written in Python. It is 5 times faster than Nagios. Shinken is compatible with Nagios, it is possible to use its plugins and configurations without making adjustments or additional configuration.
10. Icinga

Another popular open monitoring system that checks hosts and services and reports their status to the administrator. As a fork of Nagios, Icinga is compatible with it and they have a lot in common.
11. OpsView

OpsView was originally free. Now, alas, users of this monitoring system have to fork out.

Op5 is another open source monitoring system. Graphing, storing and collecting data.
Nagios alternatives
13. ZabbixOpen software to monitor and track the statuses of various services computer network, servers and network equipment, is used to get data on processor load, network usage, disk space, and the like.
14. Munin

Not a bad monitoring system that collects data from several servers at the same time and displays everything in the form of graphs, with which you can track all past events on the server.
15. Zenoss

Written in Python language using the Zope application server, the data is stored in MySQL. With Zenoss you can
monitor network services, system resources, device performance, Zenoss core analyzes the environment. This makes it possible to quickly deal with a large number of specific devices.
16. Observium

Monitoring and surveillance system network devices and servers, although the list of supported devices is huge and is not limited only to network devices, the device must support SNMP.
17. Centreon

A comprehensive monitoring system that allows you to control all infrastructure and applications containing system information. Free alternative Nagios.
18. Ganglia

Ganglia is scalable distributed system monitoring, used in high performance computing systems such as clusters and grids. Tracks statistics and computation history in real time for each of the monitored nodes.
19. Pandora FMS

Monitoring system, good productivity and scalability, one monitoring server can control the work of several thousand hosts.
20. NetXMS

Open source software for monitoring computer systems and networks.
21. OpenNMS

OpenNMS monitoring platform. Unlike Nagios, it supports SNMP, WMI and JMX.
22. HypericHQ

A component of the VMware vRealize Operations suite, it is used to monitor OS, middleware and applications in physical, virtual and cloud environments. Displays availability, performance, usage, events, logs, and changes at each level of the virtualization stack (from the vSphere hypervisor to the guest OS).
23. Bosun

An open source alert system from StackExchange. Bosun has a well thought out data schema and powerful language their processing.
24. Sensu

Sensu is an open source paging system similar to Nagios. There is a simple dashboard, you can see a list of clients, checks and triggered alerts. The framework provides the mechanisms that are needed to collect and accumulate server statistics. Each server runs the Sensu agent (client), which uses a set of scripts to check the health of services, their state and collect any other information.
25. CollectM
CollectM collects statistics on system resource usage every 10 seconds. It can collect statistics for several hosts and send it to the server, the information is displayed using graphs.
28. Performance Analysis of Logs (PAL) Tool
34. Total Network Monitor

This is a program for constant monitoring of the operation of the local network. individual computers, network and system services. Total Network Monitor generates a report and notifies you about the errors that have occurred. You can check any aspect of a service, server or file system: FTP, POP / SMTP, HTTP, IMAP, Registry, Event Log, Service State and others.
35. PRTG

38. Idera

Supports multiple operating systems and virtualization technologies. There are many free tools that you can use to monitor the system.
39. PowerAdmin

PowerAdmin is a commercial monitoring solution.
40. ELM Enterprise Manager
ELM Enterprise Manager - full monitoring from "what happened" to "what is happening" in real time. Monitoring tools in ELM include - Event Collector, Performance Monitor, Service Monitor, Process Monitor, File Monitor, PING Monitor.
41. EventsEntry

42. Veeam ONE

An efficient solution for monitoring, reporting and scheduling resources in the environment of VMware, Hyper-V and Veeam Backup & Replication infrastructure, monitors the state of the IT infrastructure and diagnoses problems before they interfere with the user experience.
43. CA Unified Infrastructure Management (formerly CA Nimsoft Monitor, Unicenter)

Monitors the performance and availability of Windows server resources.
44. HP Operations Manager

This infrastructure monitoring software performs proactive root cause analysis to reduce recovery time and operational management costs. The solution is ideal for automated monitoring.
45. Dell OpenManage

OpenManage (now Dell Enterprise Systems Management) is an all-in-one monitoring product.
46. Halcyon Windows Server Manager

Management and monitoring of networks, applications and infrastructure.
Below is a list of the (most popular) network monitoring tools
54. Ntop
55. NeDi

Nedi is an open source network monitoring tool.
54. The Dude

System monitoring Dude, although free, but according to experts, is in no way inferior commercial products, monitors individual servers, networks, and network services.
55. BandwidthD

Open source software.
56. NagVis

Extension for Nagios, allows you to create infrastructure maps and display their status. NagVis supports a wide variety of widgets, icon sets.
57. Proc Net Monitor

A free monitoring application that allows you to track all active processes and, if necessary, quickly stop them in order to reduce the load on the processor.
58. PingPlotter

Used to diagnose IP networks, to determine where losses and delays are occurring network packets.
Small but useful tools
The list would not be complete without mentioning several hardware monitoring options.60. Glint Computer Activity Monitor

61. RealTemp

A utility for monitoring temperatures of Intel processors, it does not require installation, monitors the current, minimum and maximum temperatures for each core and the start of throttling.
62. SpeedFan

A utility that allows you to control the temperature and rotational speed of the fans in the system, monitors the indicators of the sensors of the motherboard, video card and hard drives.
63. OpenHardwareMonitor

@ECHO OFF ECHO Adding counter "New_counter" ... rem Create new group data collectors logman create counter New_counter -f bincirc -c ^ "\ Processor (_Total) \ %% Processor Time" ^ "\ Memory (_Total) \ Page / sec" ^ "\ Memory (_Total) \ %% Uncommited Bytes In Use" ^ "\ Memory (_Total) \ Available Bytes" ^ "\ System (_Total) \ Processor Queue Length" ^ "\ PhysicalDisk (_Total) \ Avg. Disk Queue Lenghth" ^ "\ PhysicalDisk (*) \ Avg. Disk Queue Lenghth" ^ "\ Network Interface (*) \ Bytes Total / sec" ^ -si 15 -v mmddhhmm rem Start performance monitor C: \ Windows \ System32 \ Perfmon.exe ECHO done
Counter names are enclosed in quotation marks and separated by a space. The names of the counters can be written both in English and in Russian (but then the bat-file will work only in Russian versions of Windows). If the name of the meter contains the sign % , it must be replaced with signs %% (double percent).
After completing this file, we will immediately go to the performance monitor, where we will see the newly created group of data collectors named New_counter.

The described counters, as a rule, are enough for an overall assessment of the system load. Other counters are used for detailed investigation of problems when it is determined that there is insufficient performance of the equipment.
Did this article help you?