Before choosing the package you need, you need to evaluate its capabilities in terms of the effectiveness of the task being solved. The following is a brief description of the most famous mathematical packages:
Derive. This math package is interesting because it has the ability to use symbolic math and two graphics modes. The presence of a graphic cursor allows you to determine the coordinates of the characteristic points of the curves (extrema, roots, points of intersection with other curves). The Derive package is still attractive due to its undemanding requirements for hardware resources. This is the only package that even runs on an IBM PC XT class without a hard drive. Moreover, when solving problems of moderate complexity, it showed higher performance and greater reliability of the solution.
Mathematica. The modern mathematical package Mathematica is a powerful tool for performing and designing mathematical research both in symbolic and numerical form. It has a built-in programming language and powerful graphics capabilities. The output document can be prepared together with MS Word, MS Excel, etc. This package is unique in its richness and variety of high-level facilities and symbolic computations. The ability to carry out analytical calculations is one of the important advantages of the program. Mathematica can transform and simplify algebraic expressions, differentiate and calculate certain and indefinite integrals, expand functions into series and find limits, etc. Mathematica contains a large number of efficient algorithms for numerical calculations. The program solves many problems by numerical methods that cannot be solved analytically. The internal algorithms used by the program for operations on mathematical functions are chosen to achieve the highest possible accuracy. With all its richest features, the package has non-standard input and inconvenient output mathematical symbols, inadequate representation of the results of many operations, poor error diagnostics, and requires serious effort to master.
A serious drawback of the help system of the package, for example, in comparison with other mathematical packages, should be considered a small number of practical examples of the application of one or another operator or function described in it, and without this it is very difficult to work with mathematical packages. Missing very useful opportunity– transfer of examples from the help database directly to the editing window with the possibility of their immediate execution.
MapleV. Range functionality MapleV is very broad - the following sections are covered: differential and integral calculus, linear algebra, differential equations, geometry, statistics, number theory, group theory, optimization, numerical computing, financial functions, combinatorics, graph theory and many other areas of mathematics. MapleV's 2D and 3D graphics provide powerful scientific visualization. The MapleV package has over 20 custom plot types, as well as a large number of options available to customize how each plot is displayed. In addition, it is possible to revitalize the charts - animation. The package understands many special functions such as: Delta functions, Dirac functions, etc. MapleV has a powerful help system, which includes help files for each command, data type, language construct, and library. Another advantage of the system is the huge number of practical examples described in it and the transfer of examples from the help database directly to the editing window with the possibility of their immediate execution. In addition, this software tool can be used to generate codes in languages such as C, LaTEX, etc.
Math Cad. MathCad was designed to be a powerful calculator that makes it easy to deal with routine engineering tasks such as solving algebraic and differential equations with constants and variable parameters, analysis of functions, search for their extrema, numerical and analytical differentiation and integration, output of tables and graphs in the analysis of the solutions found.
The main advantages of the package are:
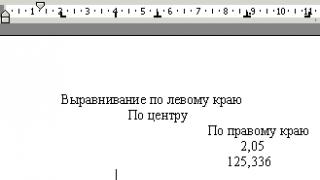
Writing complex mathematical expressions in the form in which they are usually written on a piece of paper;
Ease of use;
Carrying out numerical and analytical mathematical calculations;
The ability to create high-quality technical reports with tables, graphs, text in the form of printed documents; preparation of Web pages and publication of results on the Internet;
Input of initial data and output of results to text files or files with databases in other formats;
Ease and clarity of programming tasks; the ability to compose your own function programs using structures similar to those used by programming languages (Pascal, Fortran) and use the principles of modular programming to implement the user's computational algorithms;
Obtaining various background information from the field of mathematics and much more.
MathCad is not intended for professional mathematicians and for programming complex problems.
matlab. The MatLab package was created by MathWorks over a decade ago. Its capabilities are constantly expanding, and the algorithms embedded in it are being improved.
The range of problems that can be studied using MatLab includes: matrix analysis, signal and image processing, problems of mathematical physics, optimization problems, data processing and visualization, work with cartographic images, neural networks, fuzzy logic and many others. Specialized tools are collected in packages called ToolBox.
So, for example, the package (ToolBox) Simulink is designed for interactive simulation of nonlinear dynamic systems, consisting of standard blocks.
MatLab implements classical numerical algorithms for solving equations, linear algebra problems, finding values definite integrals, interpolation, solution of differential equations and systems.
MatLab has well developed visualization capabilities for 2D and 3D data.
A simple built-in programming language makes it easy to create your own algorithms. The simplicity of the language is offset by the sheer variety of MatLab and ToolBox features.
The GUIDE visual environment is intended for writing applications with a graphical user interface.
Methods and forms of using computer technologies in the educational process is an actual methodological and organizational task of every teacher, every administrator of a school, university.
When organizing computer support education can be divided into two areas:
- development computer programs educational purposes, programs specially designed for the study of a particular discipline;
- use of software developed for professional activities in the relevant field of knowledge; for most natural science disciplines, these are professional mathematical packages.
Mathematical packages here are called systems, environments, languages such as Mathematica, Maple V, MatLAB, Derive, Mathcad, as well as a family of statistical data analysis systems - such as SPSS, Statistica, Statgraphics, Stadia, etc. Modern mathematical packages are programs (software packages ), which have the means to perform various numerical and analytical (symbolic) mathematical calculations, from simple arithmetic calculations to solving partial differential equations, solving optimization problems, testing statistical hypotheses, tools for constructing mathematical models and other tools necessary for carrying out various technical calculations. All of them have advanced scientific graphics, a convenient help system, as well as reporting tools. The name "professional" or "universal" is used as an alternative to the name "training package".
For many years, mathematics teachers were quite clearly divided into adherents of the use of computer programs for educational purposes ("educational packages", training programs) and those who preferred to use universal packages.
It is possible to identify several key points that determined a fundamental change in the attitude of teachers and students to the use of universal mathematical packages.
The computer has become an element of "home appliances". The modern concept of quality education includes fluency in computer technology as a necessary element and, as a result, the computer is perceived as an object, if not the first, then the second necessity. Most parents cannot imagine raising their own schoolchildren without a computer. Everything more students have computers at home and more and more often it is students who initiate the use of computer technology in the educational process. They are not driven by a "gaming" interest, as we said and saw before, but by the desire to "make life easier", the desire to acquire professional skills useful for a future career, and the willingness to learn how to work on a computer not only in special classes in computer science. It can be boldly stated that home computer"is the most powerful factor that has changed the attitude of teachers to the use of a computer in their professional activities. Their position is changing under the influence of public opinion, under the influence of the position of students, and also because many teachers also have computers at home. Hence the interest in universal packages - to learn working with ready-made software is much easier than writing programs yourself.
In the modern world, standards have been formed and consolidated in the organization of the interface of computer programs. One of the problems that arise when using universal packages is the cost of study time for studying the rules of working with the program (for studying the interface). However, since the developers of scientific software and the developers of "mass consumption" packages adhere to the same standards. Thanks to this, the time to learn the interface of a particular scientific package is reduced by using the skills of working with office programs.
The struggle for the consumer, the desire to expand the circle of users, have led to the fact that while maintaining individual features, the packages converge, become so similar that the skills of working with one of them allow you to quickly get used to working in any other. Developers of mathematical packages very quickly equip their programs with all technological innovations, quickly release versions for new platforms and operating systems, improve command languages, incorporating the latest achievements in algorithmic languages, etc. The intellectual capabilities of packages are developing: new libraries, modules are added, the range of tasks available for research is expanding in accordance with fashion, with the advent of new applications, new research methods, etc.
The Internet is a new reality in the life of a modern student and specialist. Thanks to global computer networks, the user of any common software product gets the opportunity to join the global community of consumers of the same product. He will find information about new products on the net, the latest versions of the program, messages about detected errors, get expert advice, talk about his findings and get acquainted with the tricks of others, learn about literature, about the range of problems to be solved, often just find a solution to a similar problem, etc. P.
A separate place is occupied by statistical packages. Today, mathematical statistics is by far the most demanded mathematical course. The methods of data analysis studied here are widely used in practice. Therefore, mastering the methods of working in the environment of a universal statistical package is an element of high-quality professional education that is in demand on the labor market.
Math packages - tool learning activities. A university student works, his work is study. The more perfect the tools that the student uses, the higher the results he achieves. The use of mathematical packages simplifies the preparation of reports on laboratory work, helps to overcome technical mathematical difficulties in solving engineering problems, expands the range of problems available for solving, helps to present the results of calculations in a visual graphical form. If already in the junior years, when studying mathematics, physics, biology, a student masters the techniques of working with a fairly powerful professional package, then he is much better prepared for solving mathematical problems in various applications. He will not be afraid of cumbersome calculations, will be ready to solve complex problems, compensating for the lack of his own knowledge using the intellectual capabilities of the package, has the skills to present research results in a visual graphical form, and is able to draw up research results in the form of accurate meaningful reports.
Availability of universal mathematical packages and their on the professional software market. An important circumstance that until recently prevented the widespread use of professional packages within the walls of universities, is the high cost of professional scientific mathematical software. However, recently many firms that develop and distribute programs for science present for free use (including through global networks) previous versions programs, widely use the system of discounts for educational institutions, distribute demo or short-lived versions for free. Publicly available, freely distributed versions of the packages contain the main computational and graphical tools and, therefore, are quite suitable for use in the educational process (modernization of mathematical packages is carried out mainly in the direction of expanding the range of tasks available for professional research by adding more and more subtle computational methods, empowerment command languages and adaptation to the latest advances in information technology). On the other hand, the use of high-quality software contributes to the intensification of research activities, allows students to be more involved in scientific work which, as is well known, improves the chances of scientific groups in the distribution of grants, and, therefore, allows them to later find funds to purchase more modern licensed software.
Availability of documentation and reference literature on mathematical packages. If until relatively recently there was practically no literature on packages in Russian, now new versions, new packages and various manuals for users, they appear almost simultaneously. It is difficult to find a package that would not come out in Russian for two or three books.
It should be noted that developers willingly provide authors with proprietary documentation and the latest versions of packages for work. In addition, almost all developers maintain servers that host descriptions of the latest innovations, information about detected errors, extended guides for working with the package, descriptions of examples of solving typical problems, and, almost always, information about users in the academic environment with addresses, descriptions of experience and examples of use in education. It can be stated that today the reference literature on mathematical packages is publicly available - any user who wants to get acquainted with this or that package and learn how to work with it has the opportunity to get help that meets his personal needs and qualifications.
Lecture 5
Mathematical packages for solving statistical problems
1) STATISTICS
2) MathCad
3) MatLab
4) MS Excel
5) Examples of other math packages
1. STATISTICS
What mathematical package for solving statistical problems is currently considered the most popular?
Currently, the scientific and engineering community is equipped with a huge number of computational mathematical packages that implement standard solutions to standard practical problems related to both mathematics itself and its applications in any field of human activity. Now standard tasks can be solved in a matter of seconds using access to a powerful computing server from any personal mobile device.
One of the well-known and popular mathematical packages is STATISTICA program.
STATISTICA provides powerful and easy-to-use tools for statistical and graphical analysis, forecasting, data mining is a technology for identifying hidden relationships within large databases, creating your own custom applications, integration, collaboration, web access, etc.
The STATISTICA program is positioned on the Internet by the StatSoft TV website - a new unique resource containing exclusive videos on the use of STATISTICA methods and tools for solving real problems, address - http://www.statsoft.ru/
What are the main benefits of the STATISTICA program?
Benefits of using STATISTICA:
. User-friendly interface and unique customization options
The interface of STATISTICA is intuitive, easy to customize according to user tasks and is similar to the interface of standard Windows Applications so it is easy for the user to understand.
Data analysis is carried out interactively, in the mode of sequentially opening dialog boxes. Any analysis window is designed in such a way that the first tab contains only the most necessary buttons, and the subsequent tabs contain advanced methods and special options.
Thus, the beginner's attention is not distracted by additional settings and parameters, and an advanced user can always customize the analysis at their discretion.
. Unique graphics
STATISTICA includes a graphical module containing convenient tools for efficient and visual data visualization and graphical analysis. More than 10,000 different types of graphs with rich editing options, interactive settings (rotation, scaling, transparency and other features).
STATISTICA graphics are traditionally recognized as the most accurate and user-friendly.
. Ability to work with files of unlimited size, unsurpassed data processing speed
One of the important properties of STATISTICA software products is their speed when working with a large amount of data and the processing power of applications that require regular database queries, complex data management.
. Improved Calculation Accuracy
STATISTICA is the only package capable of performing many statistical calculations as accurately as possible.
. Extensive integration and compatibility options, easy data import/export, easy access to databases
Since 2008, StatSoft has been a Microsoft partner. STATISTICA is fully compliant with Microsoft standards, including Object Binding and Embedding. This allows:
- integrate new modules into existing systems;
- build an intelligent decision-making system based on STATISTICA, using STATISTICA procedures as ready-made elements.
STATISTICA allows you to directly import / export data from Microsoft Office, work in Microsoft Excel "inside" STATISTICA, automatically save the results in Microsoft Word.
STATISTICA interacts with any relational databases (Oracle, MS SQL Server, Informix, Access, etc.), business information repositories.
There is integration with the R language (a programming language for statistical data processing and graphics). http://www.statsoft.ru/products/integration/integration-with-R.php
STATISTICA interacts with Microsoft SharePoint, supports OLAP technologies - real-time analytical processing - a data processing technology that consists in preparing summary (aggregated) information based on large data arrays structured according to a multidimensional principle.
What are examples of STATISTICA integration?
Integration examples
. Automate any procedure with STATISTICA Visual Basic
Full COM oriented interface of the STATISTICA Visual Basic environment for all functions and procedures (more than 14,000 functions), automatic macro recording allow you to create custom applications and add-ons over STATISTICA to automate any weekly or lengthy procedures.
Access to all properties through the object model, powerful procedure debugger, function browser, etc. allow you to create necessary applications as quickly as possible.
STATISTICA Visual Basic is integrated with many applications (such as MS Excel) and various programming languages (C++, Java, etc.).
. Web technology support
Enterprise versions of STATISTICA are fully web-integrated: "input" and "output" of data via the Web, sending results to a Web server, building complex automated systems that work with data from external sources, performing analyzes and updating the content of HTML pages on a Web server . Possibility batch processing data. Using a multi-level client-server architecture.
. The presence of a Russified version
STATISTICA is fully translated into Russian, including an electronic reference manual and documentation. The information contains general provisions on the statistical analysis of data, detailed examples of a specific analysis.
For which fields of activity can STATISTICA be used?
STATISTICA Provides Solutions - By Industry
. Banking
. Business/Marketing
. Exploration
. Internet
. The medicine
. Education
. Industry
. Insurance
. Telecommunications
. Pharmacology
. Finance
. Economics/Sociology
. Energy
How can I master the STATISTICA program?
The manufacturer on the website http://www.statsoft.ru/ provides an opportunity to learn:
. Electronic textbook
. Interactive module
. Technical support
. Books
. Presentations
. Brochures
These features are opened through the Resources menu.
What services are available on the program manufacturer's website?
On the site http://www.statsoft.ru/ you can see:
. General videos
. Read about forecasting functions, Quality control, Statistical methods
. Data Mining - data mining is a technology for revealing hidden relationships within large databases
. Neural networks are an exceptionally powerful modeling technique that can reproduce extremely complex dependencies. In particular, neural networks are non-linear in nature. For many years, linear modeling has been the go-to modeling technique in most fields because of its well-established optimization procedures. In problems where the linear approximation is unsatisfactory (and there are quite a few of them), linear models work badly. In addition, neural networks cope with the "curse of dimensionality", which does not allow modeling linear dependencies in the case of a large number of variables.
. Big Data - Big data in information technology - a series of approaches, tools and methods for processing structured and unstructured data of huge volumes and a significant variety to obtain human-perceived results that are effective in conditions of continuous growth, distribution over numerous nodes of a computer network, formed in the late 2000s years, alternative to traditional database management systems and business intelligence class solutions
What types of STATISTICA program does the manufacturer offer?
The STATISTICA line consists of the following products:
STATISTICA Base - A wide range of basic statistics and graphical tools in an intuitive interface with all the benefits, simplicity and power of STATISTICA technologies.
STATISTICA Advanced - Includes all the features of STATISTICA Base plus powerful linear/nonlinear modeling tools, multivariate data analysis technologies, power analysis tools, and sample size calculations.
STATISTICA Quality Control - Includes STATISTICA Base, a power analysis module, as well as an industrial block of modules: Quality Control Cards, Process Analysis, Experiment Design.
In addition to the main versions, the manufacturer StatSoft offers:
. software product for neural network research, fully translated into Russian,
. a set of analytical tools, including Data Miner, Text Miner, Data Visualization, etc.
. specialized modules for solving problems in industry, retail, finance, etc.
In addition to the above, there are STATISTICA enterprise products that combine an efficient interface for accessing a central multi-user data repository, user collaboration tools and powerful statistical data analysis functionality with the benefits of enterprise work, as well as an enterprise platform for products based on industrial modules.
A separate module of the STATISTICA program highlights extended versions of STATISTICA products with the ability to generate source code in C, Java and PMML, powerful tools for analyzing unstructured text information. The advanced features of the program include the Platform for collecting, searching and business analysis of Big Data. Combines the capabilities of the latest developments in the field of Big Data:
. Scalability and performance of Hadoop
. Making selections with MapReduce
. Search engine Lucene/SOLR
. Mahout Advanced Analytics
. Working with Text Natural Language Processing
. Opportunity to work in the clouds
. access control and audit of operations,
. automation of collection, preprocessing and analysis, analytical reports,
. client-server architecture, etc.
There are also Specialized STATISTICA products that allow you to aggregate and format a large amount of source data, quickly present data in the form of visual tables, obtaining operational information for making business decisions, have a convenient tool for creating scorecards, testing and monitoring scoring models (scoring is a system for quickly assessing a client (potential borrower) using numerical statistical methods), a set of methods for conducting multivariate statistical quality management, a tool for analyzing experiments containing both fixed and random effects.
2. MathCad
Why is MathCad popular?
Mathcad is one of the most effective mathematical packages that promote both the unification of mathematics and computer science and the study of classical mathematics. It is simple enough for students to master and open enough to see behind the programming the mathematical basis of the problem being solved.
What is the main advantage of MathCad?
The MathCAD package - a product of the Mathsoft company (appeared in 1988) - is a universal mathematical package designed to perform engineering and scientific calculations. The main advantage of the package is the natural mathematical language in which the problems to be solved are formulated. In addition, the package has a powerful graphical component. Union text editor with the possibility of using a common mathematical language and graphic tools allows the user to get the finished final document in a visually pleasing form. The use of the package significantly increases the efficiency of intellectual work.
At present, many different mathematical systems: Maple, Matlab, Mathematica, Reduce, Derive, Theorist, Macsyma, etc. Each of them has its own advantages and disadvantages, as well as its own applications.
What are the main advantages and differences of the MathCAD system from similar ones?
1. Versatility. MathCAD is able to solve almost all problems from various areas applications of mathematics. It has a powerful mathematical apparatus that allows you to solve problems without calling external procedures. The list of computational tools available in the MathCAD environment is as follows:
. work with vectors and matrices (linear algebra, etc.);
. solution of algebraic equations and systems (linear and non-linear);
. solution of ordinary differential equations and systems (Cauchy problem and boundary value problem);
. calculation of integrals;
. derivative calculation;
. decomposition of a function into series;
. solution of partial differential equations;
. search for minima and maxima of functional dependencies;
. calculate and simplify symbolic expressions;
. use integrals and derivative functions for calculation;
. solve systems of linear algebraic equations, work with matrices and determinants;
. solve systems of nonlinear algebraic equations;
. build graphs both in Cartesian and cylindrical, and in polar coordinates, various diagrams and histograms;
. create programs with branching and cyclic algorithms using your own, intuitive, programming language;
. solve differential equations;
. solve problems of probability theory and mathematical statistics;
. exchange information with other applications of the Windows operating system, such as Excel, Powerpoint, Word;
. document calculations and create reporting documentation;
. has over 600 built-in mathematical functions;
. support for document templates, text formatting, formula formatting;
. improved module for working with 3D-charts;
. statistical data processing, interpolation, extrapolation, approximation and much more.
Thus, MathCAD is a powerful and simple universal environment for solving problems in various fields of science and technology, finance and economics, physics and astronomy, construction and architecture, mathematics and statistics, production organization and management. It has a wide range of tools, information and graphical tools. MathCAD is one of the most popular mathematical systems that is in demand among economists, managers, engineers, scientists and all those whose activities are related to quantitative methods of calculation.
2. Visibility. The principle of building the MathCAD interface is determined by the formula “What you see is what you get” - what you see is what you get. I.e mathematical expressions in the MathCAD environment, they are written in their generally accepted notation: the numerator is on top, and the denominator is on the bottom; the integral or derivative are familiar mathematical signs, and not symbols written in a special way that reduce the visibility of the solution; in the integral, the limits of integration are also located in the usual places. All this makes the recording understandable for the user reading the printout or looking at the screen. This feature is appreciated by those who had to solve problems using programming languages, where only a specialist with such skills can understand the essence of the solution.
In the MathCAD environment, the process of creating a model goes in parallel with its debugging. The user, having entered a new expression into the MathCAD document, can not only immediately calculate what it is equal to for certain values of the variables, but also build a graph or surface and see where an error occurred that was made when entering formulas or when creating the mathematical model itself. Symbolic mathematics tools are integrated into the MathCAD system, which not only improves the visual perception of transformations on the screen, but also allows you to solve problems or their stages both numerically and analytically.
Solving the problem, the user can enter numerical values variables and supplement them with dimensions. In this case, you can choose a system of units (SI, or another), and specific dimensions (mm, inches, feet, etc.) - MathCAD has a built-in system for automatic conversion and control of units of measurement during calculations. So, if we define the distance from one object to another as the sum of individual distances using different units of measurement (miles, feet, yards, centimeters), then the MathCAD system will automatically recalculate all distances and give the result with a pre-set unit of measurement.
In addition, the MathCAD system is equipped with animation tools, which allows you to implement the created models not only in statics, but also in dynamics ( animation clips), which greatly improves visibility.
3. Integration. MathCAD is a program that allows you to work in close integration with other systems: Microsoft Word, Excel, etc., and to effectively use Web technologies. All conventions and features of the Windows interface are supported: OLE technology, client-server, access to search programs with using the Internet Explorer in the package environment, joining a public Internet forum that brings together the worldwide community of MathCAD users.
Solving the task, it is possible to transfer data statically (via the clipboard) or dynamically (OLE technology) to the environment of another program, for example, to the environment of the Fortran language, and solve part of the problem there. Without leaving the MathCAD environment, you can open new documents on other servers and enjoy all the benefits of information technology provided by the Internet.
MathCAD can interact with other applications, for example, data from Microsoft Excel or Matlab programs can be directly included in the computational flow of the MathCAD system: here it is possible to manage drawings made in AutoCAD, use Visual Basic to create commercial applications, etc.
4. The latest versions of MathCAD have their own language, which allows the programmer to effectively apply programming code in MathCAD documents. The simplicity and intuitiveness of this language allows you to quickly learn it. Software modules inside a MathCAD document, they combine both isolation (therefore, they are easy to distinguish from other formulas) and simplicity of semantic perception. Despite the small number of operators, the MathCAD programming language allows you to solve quite complex problems.
5. For economists, the statistical and financial functions implemented in the package are important. MathCAD has a developed apparatus for working with problems of mathematical statistics. On the one hand, there are a large number of built-in special functions, allowing to calculate the probability density and other characteristics of the basic laws of distribution of random variables. MathCAD is programmed with an appropriate number of pseudo-random number generators for each distribution law, which allows efficient Monte Carlo simulations. It is possible to build histograms and calculate statistical characteristics of samples of random numbers and random processes, such as: averages, variances, correlations, etc. In this case, random sequences can either be created by random number generators or entered by the user from files.
6. MathCAD has a powerful help base built in with lots of examples, hints and convenient system search. If some problem is not fully covered in the help system, then the required answer can be found on the MathSoft website, links to which are available in the MathCAD help system.
The MathCAD package is supplemented with a reference book on the basic mathematical and physicochemical formulas and constants that can be automatically transferred to a document without typing them manually.
7. To the MathCAD package, you can purchase electronic textbooks in various disciplines: solving ordinary differential equations, statistics, thermodynamics, control theory, strength of materials, etc. Before starting to solve the problem that has arisen, the user can study the electronic textbook and transfer the necessary fragments, individual formulas and constants from it into his document.
What are the additional features of the MathCAD program?
In general, we can say that MathCAD is an environment for performing various mathematical and engineering calculations using a computer, providing the user with an extensive set of tools for implementing graphical, analytical and numerical methods for solving mathematical problems of varying complexity in any area where mathematical methods are applied. .
Not so long ago, an innovation appeared - we can only note the appearance of coordinate transformation and processing functions sound files, extension reference base and others. The main functions: solving equations, symbolic transformations, are well developed in earlier versions of the package, so they are convenient to use.
The program changes with each version and the system requirements change. For MathCAD 2001 16 Mb was enough random access memory, for latest versions - 512 MB recommended. The program runs on Windows platform.
MathCAD is focused on IBM-compatible personal computers. It automatically supports mathematical processor, which significantly increases the speed of calculations and output of graphs, which is significant due to the fact that MathCAD works in graphics mode. This is due to the fact that only in this mode it is possible to form special mathematical symbols and simultaneously apply them together with graphics and text. MathCAD supports many types of printers, as well as plotters, main types of adapters and displays.
3. Matlab
What are the features of the MATLAB program?
MATLAB is a package of applied programs for solving problems of technical calculations and the programming language of the same name used in this package. MATLAB is used by over 1,000,000 engineers and scientists and runs on most modern operating systems, including Linux, Mac OS, Solaris and Microsoft Windows.
MATLAB is perhaps the most powerful data processing program. The name comes from the abbreviation MATRIX LABoratory- matrix laboratory. As the name suggests, MATLAB is an ideal environment for working with multidimensional data, represented in the form of tables (or, in mathematical language, matrices). Most financial information belongs to this class of data: quotes, indicators, macroeconomic statistics, etc.
What is the main difference between the MATLAB interface and other similar mathematical packages?
MATLAB is not as easy to learn as, for example, Excel - beginners can be scared away by the command line. Many tasks in MATLAB are solved much easier and faster than in the same Excel. In addition, for many functions in MATLAB there is a familiar graphical interface, and the command line in practice turns out to be not so terrible, and, perhaps, after some time it will even become more convenient for you to work directly through it.
What MATLAB functions might be relevant for a student?
1. General functions for working with data: adding and deleting table elements, sorting, converting, etc. For example, in MATLAB you can very quickly flip a column of quotes “upside down” using a function, so that older data is at the top and newer data is at the bottom. This is relevant when working with some sources of quotes, from which they are downloaded the other way around (top - new, bottom - old).
2. Mathematical functions. The applications of mathematics are limited only by our imagination. The same statement applies to the mat. functions. MATLAB has great amount such built-in functions, ranging from elementary ones, for example, the logarithmic function, to special ones, such as the gamma function, etc. These functions are used as "building blocks" in solving almost any problem.
3. Numerical methods: integrals and optimizers. The need to refer to them usually arises in portfolio optimization, as well as in money and risk management. Optimization problems in MATLAB are solved using a special set of Optimization Toolbox functions. The user sets the initial portfolio weights or trading system parameters, and MATLAB uses special algorithms to iterate through them until the optimal combination is reached.
4. Statistical functions and forecasting: arithmetic mean, geometric mean, standard deviation (volatility), correlations, probability distributions, random number generators, regression, factor analysis, cluster analysis and more. etc. These functions will be useful when testing and optimizing trading systems and portfolios, visualizing and searching for dependencies in quotes. The Neural Network Toolbox, a powerful time series forecasting tool, can also be attributed to the same group of functions.
5. Special packages (Toolboxes) of financial functions:
- Econometrics. May be relevant for predicting volatility;
- Financial: quotes processing, technical analysis, bonds, portfolio optimization, options;
- Financial Derivative: advanced functions for derivatives (exotic options, options on interest rates, etc.);
- Fixed Income: advanced features for fixed income instruments such as bonds, pooled mortgages, etc.
Also, fans of technical analysis can use the Filter Design Toolbox to develop indicators of Technical Analysis based on digital filters. This is a very popular direction in the "high-tech" technical analysis.
MATLAB has convenient editor functions. With its help, you can significantly automate routine tasks by combining the built-in functions used in solving them into entire blocks of user-defined functions. There is even the possibility of creating a graphical interface for these functions in the familiar window-button style for Windows.
What programming language is built into MATLAB?
The MATLAB language is a high-level interpreted programming language that includes matrix-based data structures, wide range functions, an integrated development environment, object-oriented features and interfaces to programs written in other programming languages.
Programs written in MATLAB are of two types - functions and scripts. Functions have input and output arguments, as well as their own workspace for storing intermediate results of calculations and variables. Scripts share a common workspace. Both scripts and functions are not compiled to native code and are saved as text files.
The main feature of the MATLAB language is its wide possibilities for working with matrices, which the creators of the language expressed in the slogan "think vectorially".
What areas of mathematics does MATLAB cover?
MATLAB provides the user with a large number (several hundred) of functions for data analysis, covering almost all areas of mathematics, in particular:
. Matrices and linear algebra - matrix algebra, linear equations, eigenvalues and vectors, singularities, matrix factorization, and others.
. Polynomials and interpolation - roots of polynomials, operations on polynomials and their differentiation, interpolation and extrapolation of curves, and others.
. Mathematical statistics and data analysis - statistical functions, statistical regression, digital filtering, fast Fourier transform and others.
. Data processing - a set of special functions, including plotting, optimization, zero search, numerical integration (in quadratures), and others.
. Differential equations - solution of differential and differential-algebraic equations, differential equations with delay, equations with restrictions, partial differential equations and others.
. Sparse matrices are a special class of data MATLAB package used in specialized applications.
. Integer arithmetic - performing integer arithmetic operations in the MATLAB environment.
What toolboxes does MATLAB allow you to create?
For MATLAB, it is possible to create special toolkits that extend its functionality. Toolboxes are collections of functions written in the MATLAB language to solve certain class tasks. Mathworks provides toolkits that are used in many areas, including the following:
. digital processing signals, images and data - sets of functions that allow you to solve a wide range of problems of signal processing, images, design of digital filters and communication systems.
. Control systems - sets of functions that facilitate the analysis and synthesis of dynamic systems, design, modeling and identification of control systems, including modern algorithms management.
. Financial analysis - sets of functions that allow you to quickly and efficiently collect, process and transmit various financial information.
. Analysis and synthesis of geographical maps, including three-dimensional ones.
. Collection and analysis of experimental data - sets of functions that allow you to save and process data obtained during experiments, including in real time. A wide range of scientific and engineering measurement equipment is supported.
. Data visualization and presentation - allows you to create interactive worlds and visualize scientific information using virtual reality technologies and the VRML language.
. Development tools - sets of functions that allow you to create independent applications from the MATLAB environment.
. Interaction with external software products - sets of functions that allow you to save data in various forms so that other programs can work with them.
. Databases are tools for working with databases.
. Science and math packages — sets of specialized mathematical functions that allow you to solve a wide range of scientific and engineering problems, including the development genetic algorithms, solving problems in partial derivatives, integer problems, system optimization and others.
. Neural networks are tools for synthesizing and analyzing neural networks.
. Fuzzy logic - tools for constructing and analyzing fuzzy sets.
. Symbolic calculations are tools for symbolic calculations with the ability to interact with the symbolic processor of the Maple program.
4. MS Excel
What is the purpose of Microsoft Excel?
The Microsoft Excel program is used to work with a large amount of numerical data, the most popular spreadsheets.
The use of spreadsheets simplifies the work with data and allows you to get results without manual calculations or special programming. Spreadsheets are designed to enter and process tabular data. With them, you can perform complex calculations with large arrays of numbers, build charts and print financial reports. The main difference between a spreadsheet and a regular spreadsheet is that a variety of operations and calculations can be performed on information (data and calculation formulas) located in the cells of a spreadsheet. Spreadsheet design software is often referred to as spreadsheet processors or editors.
Microsoft Excel allows you to perform mathematical, financial and statistical calculations, draw up reports based on tables, display numerical information in the form of graphs and charts. Microsoft Excel is designed to process and store information in a tabular form, which is widely used in the activities of many users.
What are the main features of Microsoft Excel?
Spreadsheets are most widely used in economic and accounting calculations, but spreadsheets can also be used effectively in scientific and technical problems, for example, for:
. performing similar calculations on large data sets;
. automation of final calculations;
. solving problems by selecting parameter values, tabulating formulas;
. processing the results of experiments;
. search optimal values parameters;
. training spreadsheet documents;
. building diagrams and graphs according to the available data.
. a wide range of functions for various calculations;
. assigning names to tables, areas and cells and formulas entered in them, as well as inserting notes to cells;
. general spell checking, search and replace editing tools compatible with Word;
. creating custom lists for autocompletion, importing additional data into previously built charts;
. an extended set of cell formatting tools, aligning information (text and numbers) in cells, framing and shading, adjusting row heights and column widths, hiding and showing rows and columns, conditional formatting of numbers;
. a diverse selection of chart types and automation of their construction;
. search, sorting and filtering when working with lists;
. tools for quick auto-formatting of tables, the use of templates for creating standard documents;
. a wide range of ways to present data on charts and graphs, up to drawing diagrams that display relationships between data on geographical maps;
. drop-down lists, checkboxes - switches on worksheets that simplify the user's work with the table;
. inserting and working with many different objects created by other applications into the worksheet ( text documents Word, curly text WordArt, various photos, drawings, geometric shapes);
. opportunity to work with certain information like with a database;
. store information in external memory and receive copies on paper;
. wide opportunities for protecting information at the level of a sheet and a book, etc.
What are the built-in modules in Microsoft Excel?
Actions that can be used in formulas are not limited to simple arithmetic operations. More complex calculations are possible using standard features. In Excel, you can include an arbitrary function in a formula using the "Function Wizard". To facilitate selection, the functions are divided into categories. The most commonly used mathematical and statistical functions.
Once a function is selected, it is automatically entered into the formula. A special palette appears on the screen for setting function parameters. If the cursor is positioned in a parameter entry field, text appears at the bottom of the palette describing the purpose of that parameter.
As parameters, you can specify numeric values or cell addresses. Some functions can take a range of cells as a parameter.
Excel Program uses another wizard - "Chart Wizard", although in latest versions it is not called that and charts and graphs are created through the Insert tab and the Charts group.
What packages are built into the Microsoft Excel program to perform statistical analyzes and solve applied problems?
The Excel program also has built-in packages: Data Analysis and Solution Search.
Data analysis allows you to perform the main types of statistical analyzes:
. One-way analysis of variance
. Two-way analysis of variance with repetitions
. Two-way analysis of variance without repetitions
. Correlation
. covariance
. Descriptive statistics
. Exponential Smoothing
. Two-sample F - test for variance
. Fourier analysis
. bar graph
. moving average
. Random number generation
. Rank and percentile
. Regression
. Sample
. Paired two-sample t-test for means
. Two-sample t - test with equal variances
. Two-sample t-test with different variances
. Two-sample t - test for means
The function Finding a solution allows you to optimize the function, use the simplex method.
5. Examples of other mathematical packages
What math package can be used for complex math other than the above?
Waterloo's Maple math package is a software package focused on performing complex mathematical calculations and visualizing the results of calculations. The program has a convenient multi-window user interface, a help system with many examples, powerful libraries of built-in functions, and has wide possibilities in the field of programming and modeling.
Why the Maple computer math package is recommended as a basis for improvement methodological system teaching computer science at the profile level?
The positive aspects of using computer mathematical packages, in particular, the Maple system, in the process of teaching modeling, algorithmization and programming in the course of computer science within the framework of the physical and mathematical profile of training, are as follows:
- the mathematical logic and algorithmic thinking of students develops, and, as a result, the effectiveness of teaching computer science increases;
- the creative and cognitive activity of students is activated, their interest in educational activities and interest in its final result increases, both within the framework of teaching computer science and within the framework of interdisciplinary integration of computer science and other disciplines of specialized training;
- the professional orientation of students in natural science and technical activities increases, practical skills in the field of application of information technologies in the subsequent professional work develop;
- the Maple computer mathematical package has the capabilities (convenient interface, interactivity, structural and object-oriented programming, graphics) that are effective for teaching modeling, algorithmization and programming within the framework of the physical and mathematical profile of training students in computer science;
- the use of the Maple package implements the didactic principle of visibility in teaching, increases the motivation for learning and professional orientation of students, develops their scientific creativity;
- the use of an improved methodological system for teaching modeling, algorithmization and programming, focused on the use of the Maple computer mathematical package and the project method, helps to increase the effectiveness of training and the development of students' cognitive activity, the formation of the need and practical skills for using information technologies in professional activities.
What are the advantages of most math packages?
Among the many attractive properties of the considered statistical packages, we highlight the following:
1. The presence of a fairly wide range of statistical algorithms;
2. Hundreds of types of 2D and 3D charts;
3. Data exchange with other software products;
4. A large set of data manipulation options (sorting, transformation, encoding, changing the measurement scale);
5. Combining text and graphics to generate statistical reports;
6. Correction and transformation of elements graphic displays(changing color, fill, font, labels, labels, scales, etc.);
7. User interaction with data through graphics (identification of an object, dispersal of points on scatter diagrams, coloring of “interesting” objects).
Naturally, the above advantages do not fully reflect all the possibilities of data analysis that computer statistical packages have, but there is already enough information to make it clear that working with them is effective and convenient.
The presence of shortcomings and, consequently, the attractiveness of a particular package, the user can determine when direct work. Therefore, the choice in favor of the preference of any software product is given to the researcher himself, and we only have to acquaint him with the basic principles of working with statistical programs.
What other mathematical packages can be called?
. MATHEMATICS
. MAPLE
. SPSS
. MAXIMA
. STATGRAPHICS
. STADIA
. Scilab
. SMath Studio
The lecture lists only the most popular products from the field of mathematical packages. For their development, practice-oriented classes with directly installed programs are required.
Information sources
1. Mathematical methods in psychology: textbook / O. Yu. Ermolaev - Tomin. - 5th ed., Rev. and additional - M.: Yurayt Publishing House, 2014. - 511s. - Series: Bachelor. Basic course.
2. Thermotechnical studies with Excel, Mathcad and the Internet / Ed.
ed. V.F. Ochkova. Publishing house BHV-Petersburg. 2014. - 336 p.
3.MATLAB. Tutorial. Practical approach. / Vasiliev A. N. - 2nd ed., corrected. and additional - M.: Science and technology, 2015. - 448s.
informatics | ||
Math packages or |
||
computer systems |
||
mathematics |
||
CAD\CAM\CAE systems |
||
informatics |
||
Symbolic, or, as they say, computer mathematics, either |
||
computer algebra, - a large branch of mathematical |
||
modeling. In principle, programs of this kind can be classified as |
||
engineering programs for computer-aided design. So |
||
Thus, in the field of engineering design, there are three |
||
main section: |
||
CAD - Computer Aided Design; |
||
CAM - Computer Aided Manufacturing; |
||
CAE - Computer Aided Engineering. |
||
Today, serious design, urban planning and architecture, |
||
electrical engineering and a host of related industries, as well as educational |
||
technical institutions can no longer do without |
||
computer-aided design (CAD), production and |
||
calculations. |
||
Math packages are an integral part of the world of CAE systems, but |
||
some problems cannot be solved without help |
||
computer. Moreover, to the systems of symbolic mathematics today |
||
resort even theorists (the so-called pure, not applied |
||
mathematics), for example, to test their hypotheses. |
||

informatics
The range of tasks solved by CAE systems:
conducting mathematical research requiring calculations and analytical calculations;
development and analysis of algorithms;
mathematical modeling and computer experiment;
data analysis and processing;
visualization, scientific and engineering graphics;
development of graphic and calculation applications.
Math packages |
|
informatics |
Math packages or computer mathematics systems
(SCM) are programs (software packages) that have the means to perform various numerical and analytical (symbolic) mathematical calculations, from simple arithmetic calculations to solving partial differential equations, solving optimization problems, testing statistical hypotheses, tools for constructing mathematical models and others. tools necessary for carrying out various technical calculations.
All of them have advanced scientific graphics, a convenient help system, as well as reporting tools. Computer mathematics systems (CCM) or mathematical packages include systems, environments, languages such as Mathematica, Maple, MatLAB, Mathcad, as well as a family of statistical data analysis systems such as SPSS, Statistica, Statgraphics, Stadia, etc.

informatics |
Developer - Wolfram Research, Inc.
Pentium II processor or higher;
400-550 MB disk space;
operating systems: Windows 98/Me/NT 4.0/2000/2003 Server/2003x64/XP/XP x64.
The Mathematica package is widely used in calculations in modern scientific research and has become widely known in the scientific and educational environment.
The Mathematica system is one of the largest software systems and implements the most efficient calculation algorithms. Among them, for example, is the mechanism of contexts, which excludes the appearance of side effects in programs.
informatics |
The system allows solving a wide range of tasks. It combines all known mathematical methods used to solve scientific problems, including analytical and numerical calculations.
The Mathematica system allows you to simplify algebraic expressions, differentiate, calculate definite and indefinite integrals, calculate finite and infinite sums and products, solve algebraic and differential equations and systems, and expand functions into series and find limits.
Mathematica solves problems numerically (i.e., approximate methods) that cannot be solved analytically. It allows you to solve optimization problems (linear programming, finding the extrema of functions), problems of mathematical statistics.
The system is equipped with a help base.
Mathematica's rich numerical and symbolic capabilities, powerful graphical capabilities (including animation), built-in programming language, and convenient means building hypertext links between documents makes this system attractive both for research and practical activities, and for teaching students.

informatics | |||
Central to class systems |
|||
Mathematica takes machine- | |||
independent core of mathematical |
|||
operations, which allows you to transfer |
|||
system to various computer |
|||
platforms. To transfer the system to |
|||
other computer platform |
|||
software is used | |||
front end interface processor. |
|||
It is he who determines what kind |
|||
system user interface. |
|||
The core is made quite compact |
|||
in order to be very |
|||
quickly call any function from it. |
|||
To expand the range of functions are |
|||
library (Library) and a set of packages |
|||
extensions (Add-on Packages). Packages |
|||
extensions are prepared in-house |
|||
systems programming language | |||
Mathematica and are the main |
|||
The disadvantages of the Mathematica system include only | means for developing opportunities |
||
that a very unusual programming language, an appeal to | systems and their adaptation to the solution |
||
which facilitates detailed system help | specific classes of user tasks. |
||
Maxima and Kalamaris | |||
informatics | |||
Maxima is a non-commercial |
|||
project with open source. IN |
|||
program Maxima for | |||
mathematical work | |||
language used is similar to |
|||
language in the Mathematica package, and |
|||
GUI | |||
built on the same principles. |
|||
Initially the program | |||
was called Xmaxima and | |||
created for UNIX systems. |
|||
Maxima now has an even more powerful, efficient and |
|||
friendly cross-platform GUI that |
|||
called Wxmaxima | |||

Maxima and Kalamaris | |||
informatics | |||
Kalamaris is a project that has an approach and ideology similar to | |||
Mathematica system. The project is a good free | |||
alternative to such commercial product like Mathematica. | |||
informatics | |||
Minimum Requirements |
|||
to the system: | |||
CPU Pentium III | |||
128 MB RAM |
|||
256 MB); | |||
400 MB disk | |||
space; | |||
Operating Systems: |
|||
(SP5)/98/ME/2000/2003 |
|||
Server/XP Pro/XP Home |
|||
This is the most successful | |||
balanced system and | |||
the undisputed leader in opportunities |
|||
symbolic calculations for | |||
mathematics and maybe | |||
used for small |
|||
tasks, as well as for serious | |||
projects. |
|||

informatics | |||
Maple's character analyzer is the most | |||
a strong part of this software, which is why it was borrowed |
|||
and included in a number of other CAE packages such as MathCad and MatLab, |
|||
as well as in packages for the preparation of scientific publications | |||
Scientific WorkPlace and Math Office for Word. | |||
The Maple package is a joint development of the University of Waterloo (pc. |
|||
Ontario, Canada) and the ETHZ (ETHZ, Zurich, | |||
Switzerland). A special company was created to sell it - |
|||
Waterloo Maple, Inc., which, unfortunately, is more famous | |||
mathematical elaboration of your project than the level of its | |||
commercial implementation. As a result, the Maple system was previously |
|||
available mainly to a narrow circle of professionals. Now this |
|||
the company works in conjunction with a more commercially prosperous and |
|||
in the development of the user interface of mathematical systems |
|||
by MathSoft, Inc. | |||
informatics | |||
This product is often referred to as a symbolic computing system or |
|||
computer algebra system. | |||
Maple allows you to perform both numerical and analytical calculations |
|||
with the ability to edit text and formulas on the worksheet. |
|||
Thanks to the presentation of formulas in polygraphic format, | |||
stunning 2D and 3D graphics and animation, Maple is |
|||
at the same time a powerful scientific graphics editor. | |||
Simple and efficient interpreter language, open architecture, |
|||
the ability to convert Maple codes to C codes makes it very |
|||
effective means of creating new algorithms. | |||
Intuitive interface with simple rules |
|||
work and wide functionality, this product has already won | |||
popularity among Russian mathematicians and engineers. | |||
Maple is the first universal math package | |||
which offers native TCP/IP protocol support for |
|||
providing dynamic access to information from other Internet |
|||
resources, such as data for real-time financial analysis |
|||
time or weather data. | |||

Department of Alternative Packages
informatics
IN As simpler, but ideologically close alternatives to the Maple program, one can note such packages as Derive, Scientific WorkPlace and YaCaS
informatics |
YaCaS (an acronym for Yet Another Computer Algebra System) is a free, cross-platform alternative to Maple built on the same principles. The powerful and highly efficient YaCaS engine is fully implemented in C++ under an open source license (OpenSource). The interface, of course, is poorer and simpler, but quite convenient.

informatics |
informatics
Minimum system requirements:
processor Pentium III, 4, Xeon, Pentium M; AMD Athlon, Athlon XP, Athlon MP;
400 MB of disk space (only for the MatLab system itself and its Help);
operating system Microsoft Windows 2000 (SP3)/XP.
MatLab is one of the oldest, carefully designed and time-tested systems for automating mathematical calculations, built on an extended representation and application of matrix operations. This is reflected in the very name of the system - MATrix LABoratory, that is, the matrix laboratory.
In addition to its own excellent computing facilities, a symbolic transformation engine was purchased from Waterloo Maple under license for MatLab.
Later, libraries also appeared that provide functions unique to math packages in MatLab. For example, the well-known Simulink library, implementing the principle of visual programming, allows you to build a logical diagram of a complex control system from building blocks alone, without writing a single line of code. After constructing such a circuit, you can analyze its operation in detail.

informatics | ||||
There are also ample opportunities for programming in the MatLab system. Her |
||||
the C Math library (MatLab compiler) is object-based and contains over 300 |
||||
data processing procedures in the C language. Inside the package, you can use both | ||||
procedures of MatLab itself, and standard procedures C language, which makes this |
||||
tool is a powerful tool for developing applications (using | ||||
C Math compiler, you can embed any MatLab procedures into ready-made | ||||
applications). | ||||
All MatLab libraries are different high speed numerical calculations. but |
||||
matrices are widely used not only in such mathematical calculations as solving |
||||
problems of linear algebra and mathematical modeling, calculation of static |
||||
systems and objects. | ||||
They are the basis for the automatic compilation and solution of equations of state |
||||
dynamic objects and systems. It is the versatility of the matrix apparatus |
||||
calculus significantly increases interest in the MatLab system, which incorporates | ||||
the best achievements in the field of fast solution of matrix problems. Therefore MatLab |
||||
has long gone beyond the specialized matrix system, turning into |
||||
one of the most powerful universal integrated computer systems |
||||
mathematics. | ||||
To visualize the simulation, the MatLab system has the Image Processing library |
||||
Toolbox, which provides a wide range of features that support | ||||
visualization of ongoing calculations directly from the MatLab environment, magnification |
||||
and analysis, as well as the possibility of building image processing algorithms. | ||||
Octave and Scilab | ||||
informatics | ||||
Now there are two free analogues of the MATLAB package at once. | ||||
The first of these is Scilab, which is being developed by the French | ||||
Institute for Research in Informatics and Automation |
||||
(INRIA) and the second is the Octave project. | ||||
Programs have an interface similar to the interface of early | ||||
versions of MATLAB, retain the ideology of MATLAB, and practically | ||||
repeat his language. | ||||
To install the programs, just download the necessary | informatics | |||
informatics | ||||
Minimum | ||||
requirements to | ||||
Pentium II processor | ||||
or higher; | ||||
random access memory | ||||
MB or more) | ||||
200-400 MB | ||||
disk | ||||
space; | ||||
operating rooms | ||||
systems: Windows | ||||