Many users have experienced first-hand the benefits of gadgets in the Windows Vista and Windows 7 operating systems. In this article we will look at gadgets that take temperature readings from processor and video card sensors on the Desktop. We will also tell you how to use these gadgets on Windows 8, 8.1 and Windows 10 operating systems.
Installing processor and video card temperature gadgets
To measure the temperature of the processor and video card on the desktop, we will need gadgets and. Both gadgets are distributed through the website http://addgadgets.com, where they can be downloaded for free. To install these applications on Windows 7, you just need to run the downloaded files. In our case, these are the files “All_CPU_Meter_V4.7.3” and “GPU_Meter_V2.4”. The CPU temperature gadget looks like this.
And the widget for the video card looks like this.

You can see from the images that there are no temperature readings in these apps. In order for them to have temperature characteristics, you need a utility PC Meter. The archive with this utility can be downloaded from the same site as the gadgets. After unpacking the archive, the utility can be launched immediately, since it does not require installation. To launch the utility, the executable file PCMeterV0.4.exe is used.

After launch, the utility will be built into the notification area.

The program is launched by clicking on its shortcut in the control area. The program settings are located in the menu " Options" In these options the user can configure the window to be minimized PC Meter, loading at system startup and support for the widgets in question.

To display the temperature in you need to go to its options to the tab " Options».

On this tab in the line " Show CPU temperatures"you need to set the parameter " ON (PC Meter)" To save the parameters, click OK. After this setting, in the processor widget you can see the temperature of the AMD A6-5400K processor, which is 17 degrees for each core.

Also, in the options of this application, the PC user is provided with selecting temperature unit and customization options sound alert when processor temperature is high. For the widget, let’s also go to the “ Options».

In line " Select Method" select the parameter " PC Meter*" To save the parameters, you must click the OK button, as for the previous widget. Having set these settings, we will see the temperature of the AMD Radeon HD 7540D video card in the gadget, which is 14 degrees.

Just like in the previous gadget, in this one on the “ Options» You can configure a sound indicator that will alert you when the GPU temperature is high. On the " Color", which is present in both applications, you can customize the colors of the displayed lines in their windows.
The example shows that using these gadgets, the user will always know the thermal characteristics of the processor and video card, and will also be able to find out when they are overheating.
Launching All CPU Meter and GPU Meter in Windows 8 and 10
To launch the gadgets discussed above, we need a utility 8GadgetPack. This utility is a collection of various widgets. A nice addition for the user is that he does not need to download the widgets discussed above, since they are already included in 8GadgetPack.
You can download the utility from its official website http://8gadgetpack.net. After installation, for example, in Windows 10, in the context menu you can see the item “ Gadgets».

The design of the window with a set of widgets closely resembles the window from Windows 7.

Setting up and installing new widgets is the same as in the seven, so any PC user can figure it out.
If you have Windows XP operating system on your computer, you will not be able to use the program 8GadgetPack, since it is not supported in this OS version. To use widgets for XP on the Desktop, we recommend using a free utility Xwidget. For example, in Xwidget You can find popular desktop monitoring application like Afterburner from MSI.
This program supports many widgets in which you can monitor the temperature in XP. Also Xwidget can be used in both seven and ten without any problems.
Let's sum it up
In this article, we got acquainted with widgets for monitoring the temperature indicators of the central processor and video card on the Desktop. From the examples discussed, it is clear that any PC user can launch and configure widgets. You can study additional material to learn how to install others by following the link.
We hope that this material will be useful to you and will allow you to easily monitor the system using the widgets discussed.
Video on the topic
Introduction
The loading indicators that will be discussed are not only an improvement in appearance, but also have purely practical benefits.
This article consists of two independent parts: processor and hard drive load indicator.
Hard drive loading indicator
Before starting to create the indicator, I decided to look for the most optimal scheme. After browsing through a number of sites, I found a relatively small variety of schemes. One of the most important criteria is to get a high-quality mod for relatively little money. Most circuits use LM3914 chips, which are not that cheap. Therefore, I began to look for a level indicator chip with an output of 5-8 LEDs. The choice fell on AN6884 due to its low price and wide availability. This microcircuit has five LEDs at the output, and passes 7mA current through each.
To read the signal, two wires coming from the motherboard are used, to which the hard drive indicator LED located on the front panel is connected. Instead of an LED, an optocoupler input is connected to them (see diagram). Even if you reverse the polarity, nothing will burn. The optocoupler in the diagram is necessary for electrical isolation of the circuits of the motherboard and the indicator (this is primarily necessary to protect the motherboard).
At zero load - the phototransistor inside the optocoupler is locked - while C6 is discharged through R11. When the hard drive load increases, the phototransistor is open, and C6 begins to charge through it. The voltage on C6 changes in proportion to the load level. Depending on the capacity of C6, the rate of change in the load level changes.
The voltage from C6 is removed through the divider R12, R14. Trimmer resistor R14 is used to change the sensitivity of the indicator.
You can install any LEDs at your discretion. For myself, I set the three smaller levels to green, and the two larger ones to red.
Hard drive indicator circuit
Setting up the indicator comes down to setting its sensitivity using R14.
CPU load indicator
When the hard drive indicator was already made, I began to think about an indicator for something else. The choice fell on the processor load indicator.
During the search, two options were found - through LPT and through COM.
I chose the COM port only because it was not used, unlike LPT. While searching, I found an article by Clear66, in which he talked about connecting a car tachometer to a COM port. I liked this idea most of all because there is no need to make special circuits for converting digital values into an analog signal. The PCTach program is used for control (download link is at the end of the article).
But since there was no tachometer at hand at that moment, I had to make a homemade version of the factory one. After assembly and configuration, the processor load indicator began to show more or less accurately.
But I didn’t like the increased speed of displaying the load level, which was expressed by excessive twitching of the indicator arrow when the processor load was uneven. But this was corrected by adding an additional capacitor in parallel with the microammeter.
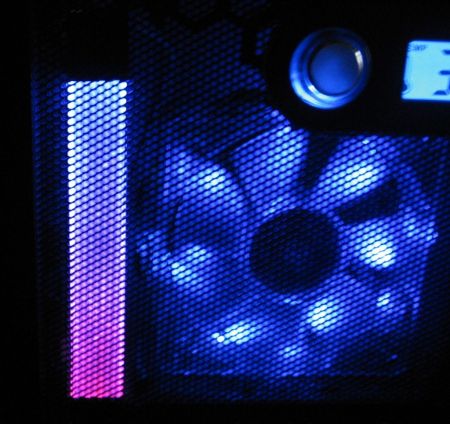
The appearance of the dial indicator did not suit me much, and I decided to look for an alternative. Ultimately, the indicator became LED, and not a scale of LEDs, but two LEDs of different glow colors directed towards each other. The load level is displayed by smoothly changing the brightness of the LEDs.
To make the indicator, I used 4-5mm plexiglass and two LEDs: red and blue. A strip measuring 150mm by 15mm is cut out of plexiglass. After this, places for LEDs are cut out along the edges of the strip. The ends and one side of the strip should be sanded with zero-grade sandpaper to a uniform matte finish. This is necessary for uniform dispersion of light. A strip of foil is glued to the back side (which is not sanded) and to the sides of the strip to reflect the rays of the LEDs. When the strip is ready, the LEDs are glued.
Arrangement of LEDs in a strip of plexiglass
When the LEDs are already glued, electrical tape or self-adhesive film is glued to the ends of the strip. This is necessary so that the LEDs shine only in the desired part of the strip.
Blue on top symbolizes cold, i.e. low CPU load. Red below symbolizes heating, i.e. big load. The processor load is proportional to the transition of colors between each other. The wires going to the board and a 68-100 Ohm resistor are fixed at one edge of the strip using hot glue.
To smoothly change the brightness of the LEDs, a PWM signal generation circuit is used. With this control method, the brightness of the LEDs varies depending on the ratio of the time it is lit and the time it is not lit. This method is better than voltage control in that the brightness of the LEDs changes in proportion to the voltage.
The scheme consists of the following blocks:
voltage driver on DA1.1
Ramp generator on DA2
voltage comparison unit for DA1.2 DA1.3
The resistor divider R4, R3 sets the voltage to 1.2 volts, which is approximately equal to the minimum voltage of the sawtooth pulses DA2. Pulses are taken from the third pin of the computer's COM port. When the input level is high, capacitor C1 is charged through resistor R1 and diode D1. When the input level is low, capacitor C1 is discharged through R2. A voltage proportional to the processor load level is generated at C1. Since the amplitude of this voltage is less than the amplitude of the sawtooth pulses DA2, an amplifier on DA1.1 is present in the circuit. The maximum level of the indicator is adjusted by changing the gain using R6. The R7, C3 chain finally smoothes out the voltage ripple from the amplifier output. PWM is generated by comparing the measured voltage and sawtooth pulses.
DA1.2 generates a direct, and DA1.3 an inverted PWM signal. These two signals are then sent to LEDs, pre-amplified by switches on transistors T3, T4.
Processor indicator circuit

Execution
Since both indicators are located on the front panel, I made a common board for them. On one edge of the board there are two strip-shaped tracks. Two M3 nuts are soldered to these strips. In the front of the housing frame, two 3mm holes are drilled so that they correspond to the distance between the centers of the nuts on the board. Next, two M3 screws are screwed into these nuts on the board, which pass through the holes in the frame.


CPU load indicator with different load levels:


System Resource Monitor
Programs for measuring resources, or as they are also called resource monitors, display specific information indicators of the state of the system. And if a little simpler, then, basically, this is data on processor load, the amount of RAM used and disk space used. Such utilities allow you to find out the reasons for the loss of system performance and find out the current load of your computer. They are quite popular among users who often work with technology.
Some of these programs are more focused on diversity of information, i.e. allow a much clearer understanding of the state of the system. And, most likely, they will be more suitable for administrators whose tasks are more complex than just finding out how much memory your programs are eating. Other programs are more focused on the attractiveness of the interface and the ability to integrate into the standard system interface, for example, in the form of widgets. As you probably guessed, these programs are more suitable for ordinary users who under no circumstances will need information about the number of threads and processes, except to broaden their horizons.
In this review you will find both functional and stylized programs.
Review of Free System Resource Monitors
Rainmeter program complete control of system resources
Quick Selection Guide (links to download free system resource monitors)
Rainmeter
| Stylization. A huge number of modules and skins to display. Incredibly flexible display settings. | ||
| Configuration via INI files (this will be very difficult for regular users). Some modules may not work correctly. |
Spotlight on Windows
| Professional. Attractive. Multifunctional. Remote monitoring. | ||
| Full screen mode only. Fonts cannot be changed. Fixed maximum values. Registration required. The license must be renewed every year. |
Sysmetrix
| Stylization. Wide variety of indicators. Easy setup. | ||
| Only one template for all indicators, cannot be divided into separate widgets. Displays only the total processor load. |
TinyResMeter
| Fast. Effective. Very small size. | ||
| Poor setting. Old GUI. |
StatBar
| Takes up little space on the screen. Setting up indicators. A number of additional controls (Winamp and others). | ||
| You can't change the font, which makes the program inconvenient for high-resolution screens. |
Dear readers, if you use Windows 10, then I suppose you have wondered where the usual gadgets (processor load indicator, clock, weather, etc.) are in this operating system, as in Windows 7. I will answer you - they are not there. Windows 10 developers decided not to install gadgets, as they were replaced by new application tiles. However, you can easily install familiar gadgets on Windows 10 thanks to special third-party programs.
Today we will look at two such programs that can add gadgets to Windows 10. So, let's go!
Windows Desktop Gadgets
This utility will return gadgets to the new Windows 10 OS in the form in which they were in the “seven”. Also, everything is in Russian, with the same interface. You can download it at http://gadgetsrevived.com/download-sidebar/
We install the program and after that we see the usual gadgets window. Here we see all the gadgets as in Windows 7 - clock, calendar, weather, puzzle and other original utilities.

By double clicking on the gadget you can place it on your desktop,

To open the gadgets window, you need to right-click on the desktop and select Gadgets.

As you can see, everything is easy and simple. In a couple of clicks, the gadgets returned to the new operating system.
8GadgetPack
8GadgetPack is another free analogue, thanks to which you can return gadgets to the Windows 10 operating system. This utility is more functional than the one described above, but it is partially in Russian. Download from the website http://8gadgetpack.net/

Although the program is partially in Russian, I think it won’t be too difficult to figure it out. It has a much larger selection of gadgets, as they say, for all occasions.
So, let's summarize. We looked at two programs that return gadgets in Windows 10. One and two programs allow you to download other third-party desktop gadgets. But there is one caveat: not all gadgets will work, as the developers note. However, a standard set of gadgets is enough for most users.
If you have questions, ask in the comments. All the best!