The standard load test is designed to evaluate the performance of server hardware and software in the so-called "Standard 1C Users". The main scope of this test is the choice of server hardware and software configuration for the purposes of a particular implementation.
Tasks to be solved
- Calculating the performance of a given configuration of server hardware and software
- Performance Comparison of Different Server Hardware and Software Configurations
- Selection of equipment required for the operation of this information system
- Calculation of the parameters of the equipment necessary for the operation of this information system
What does the test evaluate?
The test evaluates the performance the whole set of server hardware and server software in terms of tasks typical for systems running on the 1C:Enterprise 8 platform. That is, the resulting score does not reflect the performance of any one server component of the system (for example, the working server of the 1C:Enterprise cluster), but of the entire server configuration as a whole. The server part of the system, the performance of which is measured by this test, includes:
- all working servers used to deploy the 1C:Enterprise cluster and DBMS servers
- operating systems of all working servers;
- settings for operating systems, 1C:Enterprise and DBMS.
During testing, the test will automatically increase the number of concurrent users until one of the hardware or software components of the system can no longer cope with the load. This will result in a bad performance score and the test will stop with the last good value as the result. In this case, the remaining components may be underloaded to one degree or another.
Thus, the test evaluates the performance of the server part of the system according to the bottleneck, that is, its least productive component.
If the server part of the system is not well balanced to work with 1C:Enterprise, then when the bottleneck is eliminated (replacing or upgrading the least performing component), you can get a higher performance rating.
You should pay attention to the fact that the test does not evaluate the performance of the client part of the system in any way, so this factor should be completely excluded. In other words, client workstations should not become the bottleneck of the system. This issue is discussed in more detail in the chapter "Preparing the client side of the test bench".
How the test works
The standard load test is a 1C:Enterprise 8.2 infobase with a configuration based on Manufacturing Enterprise Management. The configuration is merged with Test Center 2.0, which includes one test script.
The test scenario includes emulation of the business process "sales in the PDS", namely: the creation of several different documents, the generation of reports and other applied actions. The test works in full parallel mode, that is, each user works with their own unique data, and there are no waiting on locks. The user completes one complete sale cycle per minute.
Photo by Alena Tulyakova, IA Clerk.Ru
The article indicates the main mistakes that novice 1C administrators make, and shows how to solve them using the example of the Gilev test.
The main purpose of writing the article is not to repeat the obvious nuances to those administrators (and programmers) who have not yet gained experience with 1C.
A secondary goal, if I have any shortcomings, Infostart will point this out to me the fastest.
V. Gilev's test has already become a kind of "de facto" standard. The author on his website gave quite understandable recommendations, but I will simply give some results and comment on the most likely errors. Naturally, the test results on your equipment may differ, this is just a guideline, what should be and what you can strive for. I want to note right away that changes must be made step by step, and after each step, check what result it gave.
There are similar articles on Infostart, in the relevant sections I will put links to them (if I miss something, please tell me in the comments, I will add it). So, suppose you slow down 1C. How to diagnose the problem, and how to understand who is to blame, the administrator or the programmer?
Initial data:
Tested computer, main guinea pig: HP DL180G6, 2*Xeon 5650, 32 Gb, Intel 362i , Win 2008 r2. For comparison, comparable results in a single-threaded test are shown by the Core i3-2100. The equipment was specially taken not the newest, on modern equipment the results are noticeably better.
For testing remote 1C and SQL servers, SQL server: IBM System 3650 x4, 2*Xeon E5-2630, 32 Gb, Intel 350, Win 2008 r2.
To test the 10 Gbit network, Intel 520-DA2 adapters were used.
File version. (the base lies on the server in the shared folder, clients are connected on a network, the CIFS/SMB protocol). Step by step algorithm:
0. Add the Gilev test database to the file server in the same folder as the main databases. We connect from the client computer, run the test. We remember the result.
It is assumed that even for old computers 10 years ago (Pentium on 775 socket), the time from clicking on the 1C:Enterprise shortcut to the appearance of the database window should be less than a minute. (Celeron = slow work).
If your computer is worse than a 775 socket pentium with 1 GB of RAM, then I sympathize with you, and it will be difficult for you to achieve comfortable work on 1C 8.2 in the file version. Consider either upgrading (long overdue) or switching to a terminal (or web, in the case of thin clients and managed forms) server.
If the computer is not worse, then you can kick the administrator. At a minimum, check the operation of the network, antivirus, and HASP protection driver.
If Gilev's test at this stage showed 30 "parrots" and more, but the 1C working base still works slowly - the questions are already for the programmer.
1. For a guideline, how much a client computer can "squeeze out", we check the operation of only this computer, without a network. We put the test base on the local computer (on a very fast disk). If the client computer does not have a normal SSD, then a ramdisk is created. So far, the simplest and free one is Ramdisk enterprise.
To test version 8.2, 256 MB of a ramdisk is enough, and! The most important. After restarting the computer with a working ramdisk, it should have 100-200 MB free. Accordingly, without a ramdisk, for normal operation of free memory there should be 300-400 MB.
For testing version 8.3, a 256 MB ramdisk is enough, but more free RAM is needed.
When testing, you need to look at the processor load. In a case close to ideal (ramdisk), the local file 1c loads 1 processor core during operation. Accordingly, if during testing your processor core is not fully loaded, look for weaknesses. A little emotional, but generally correct, the influence of the processor on the operation of 1C is described. Just for reference, even on modern Core i3 with a high frequency, the numbers 70-80 are quite real.
The most common mistakes at this stage.
- Incorrectly configured antivirus. There are many antiviruses, the settings for each are different, I can only say that with proper configuration, neither the web nor Kaspersky 1C interfere. With the "default" settings - about 3-5 parrots (10-15%) can be taken away.
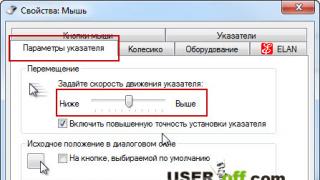
- performance mode. For some reason, few people pay attention to this, and the effect is the most significant. If you need speed, then you must do it, both on client and server computers. (Gilev has a good description. The only caveat is that on some motherboards, if Intel SpeedStep is turned off, then TurboBoost cannot be turned on).
You can (and preferably) enable performance mode in two places:
- through the BIOS. Disable C1, C1E, Intel C-state (C2, C3, C4) modes. In different bios they are called differently, but the meaning is the same. Search for a long time, a reboot is required, but if you did it once, then you can forget. If everything is done correctly in the BIOS, then the speed will be added. On some motherboards, BIOS settings can be set so that the Windows performance mode will not play a role. (Examples of BIOS setup by Gilev). These settings mainly concern server processors or "advanced" BIOS, if you haven't found it in your system, and you don't have Xeon - it's okay.

- Control Panel - Power - High performance. Minus - if the computer has not been serviced for a long time, it will buzz more strongly with a fan, it will heat up more and consume more energy. This is the price of performance.
| These are the default settings. BIOS C-state enabled, balanced power mode |  |
| BIOS C-state enabled, high performance mode For Pentium and Core, you can stop there, you can still squeeze some "parrots" out of Xeon |  |
| In BIOS, C-states are off, high performance mode. If you do not use Turbo boost - this is how it should look server tuned for performance |  |
And now the numbers. Let me remind you: Intel Xeon 5650, ramdisk. In the first case, the test shows 23.26, in the latter - 49.5. The difference is almost twofold. The numbers may vary, but the ratio remains pretty much the same for the Intel Core.
Dear administrators, you can scold 1C as you like, but if end users need speed, you must enable high performance mode.
c) Turbo Boost. First you need to understand if your processor supports this function, for example. If it does, then you can still quite legally get some performance. (I don’t want to touch on the issues of overclocking, especially servers, do it at your own peril and risk. But I agree that increasing the Bus speed from 133 to 166 gives a very noticeable increase in both speed and heat dissipation)
How to turn on turbo boost is written, for example,. But! For 1C, there are some nuances (not the most obvious). The difficulty is that the maximum effect of turbo boost is manifested when the C-state is turned on. And it turns out something like this picture:

Please note that the multiplier is the maximum, the Core speed is the most beautiful, the performance is high. But what will happen as a result of 1s?
But in the end, it turns out that according to CPU performance tests, the variant with a multiplier of 23 is ahead, according to Gilev's tests in the file version, the performance with a multiplier of 22 and 23 is the same, but in the client-server version, the variant with a multiplier of 23 horror horror horror (even if C -state set to level 7, it is still slower than with C-state turned off). Therefore, the recommendation, check both options for yourself, and choose the best one from them. In any case, the difference between 49.5 and 53 parrots is quite significant, especially since it is without much effort.
Conclusion - turbo boost must be included. Let me remind you that it is not enough to enable the Turbo boost item in the BIOS, you also need to look at other settings (BIOS: QPI L0s, L1 - disable, demand scrubbing - disable, Intel SpeedStep - enable, Turbo boost - enable. Control Panel - Power - High performance) . And I would still (even for the file version) stop at the option where c-state is turned off, even though the multiplier is less there. Get something like this...

A rather controversial point is the memory frequency. For example, the memory frequency is shown as very influential. My tests did not reveal such dependence. I will not compare DDR 2/3/4, I will show the results of changing the frequency within the same line. The memory is the same, but in the BIOS we force lower frequencies.
 |  |  |
And test results. 1C 8.2.19.83, for the file version local ramdisk, for client-server 1C and SQL on one computer, Shared memory. Turbo boost is disabled in both options. 8.3 shows comparable results.
The difference is within the measurement error. I specifically pulled out the CPU-Z screenshots to show that other parameters change with the frequency change, the same CAS Latency and RAS to CAS Delay, which levels out the frequency change. The difference will be when the memory modules physically change, from slower to faster, but even there the numbers are not very significant.
2. When we figured out the processor and memory of the client computer, we move on to the next very important place - the network. Many volumes of books have been written about network tuning, there are articles on Infostart (, and others), here I will not focus on this topic. Before starting testing 1C, please make sure that iperf between two computers shows the entire band (for 1 Gbit cards - well, at least 850 Mbit, but better 950-980), that Gilev's advice is followed. Then - the simplest test of work will be, oddly enough, copying one large file (5-10 gigabytes) over the network. An indirect sign of normal operation on a network of 1 Gbps will be an average copy speed of 100 Mb / s, good work - 120 Mb / s. I want to draw your attention to the fact that the processor load can also be a weak point (including). The SMB protocol on Linux is rather poorly parallelized, and during operation it can quite easily “eat” one processor core and not consume it anymore.
And further. With default settings, windows client works best with windows server (or even windows workstation) and SMB / CIFS protocol, linux client (debian, ubuntu did not look at the rest) works best with linux and NFS (it also works with SMB, but on NFS parrots above). The fact that during linear copying, the Win-Linux server on NFS is copied into one stream faster, does not mean anything. Tuning debian for 1C is a topic for a separate article, I'm not ready for it yet, although I can say that in the file version I even got a little better performance than the Win version on the same equipment, but with postgres with users over 50 I still have everything very bad.
The most important thing is what the "burnt" administrators know about, but beginners do not take into account. There are many ways to set the path to the 1c database. You can make servershare, you can 192.168.0.1share, you can net use z: 192.168.0.1share (and in some cases this method will also work, but not always) and then specify drive Z. It seems that all these paths point to the same thing the same place, but for 1C there is only one way that gives a fairly stable performance. So here's what you need to do right:
On the command line (or in policies, or whatever suits you) - do net use DriveLetter: servershare. Example: net use m:serverbases. I specifically emphasize, NOT the IP address, but the server name. If the server is not visible by name, add it to dns on the server, or locally to the hosts file. But the appeal must be by name. Accordingly, on the way to the database, access this disk (see the picture).

And now I will show in numbers why such advice. Initial data: Intel X520-DA2, Intel 362, Intel 350, Realtek 8169 cards. OS Win 2008 R2, Win 7, Debian 8. Latest drivers, updates applied. Before testing, I made sure that Iperf gives the full bandwidth (except for 10 Gbit cards, it turned out to squeeze out only 7.2 Gbit, later I'll see why, the test server is not yet configured properly). The disks are different, but everywhere is an SSD (specially inserted a single disk for testing, nothing else is loaded) or a raid from an SSD. The speed of 100 Mbit was obtained by limiting the settings of the Intel 362 adapter. There was no difference between 1 Gbit copper Intel 350 and 1 Gbit optics Intel X520-DA2 (obtained by limiting the speed of the adapter). Maximum performance, turbo boost is disabled (just for comparability of results, turbo boost adds a little less than 10% for good results, for bad results it may not affect at all). Versions 1C 8.2.19.86, 8.3.6.2076. I do not give all the numbers, but only the most interesting ones, so that there is something to compare with.
| 100Mbit CIFS Win 2008 - Win 2008 calling by ip address | 100Mbit CIFS Win 2008 - Win 2008 address by name | 1 Gbit CIFS Win 2008 - Win 2008 calling by ip address | 1 Gbit CIFS Win 2008 - Win 2008 address by name | 1 Gbit CIFS Win 2008 - Win 7 address by name | 1 Gbit CIFS Windows 2008 - Debian address by name | 10Gbit CIFS Win 2008 - Win 2008 calling by ip address | 10Gbit CIFS Win 2008 - Win 2008 address by name |
|
| 11,20 | 26,18 | 15,20 | 43,86 | 40,65 | 37,04 | 16,23 | 44,64 | |
| 1С 8.2 | 11,29 | 26,18 | 15,29 | 43,10 | 40,65 | 36,76 | 15,11 | 44,10 |
| 8.2.19.83 | 12,15 | 25,77 | 15,15 | 43,10 | 14,97 | 42,74 | ||
| 6,13 | 34,25 | 14,98 | 43,10 | 39,37 | 37,59 | 15,53 | 42,74 | |
| 1C 8.3 | 6,61 | 33,33 | 15,58 | 43,86 | 40,00 | 37,88 | 16,23 | 42,74 |
| 8.3.6.2076 | 33,78 | 15,53 | 43,48 | 39,37 | 37,59 | 42,74 |
Conclusions (from the table, and from personal experience. Applies only to the file version):
- Over the network, you can get quite normal numbers for work if this network is normally configured and the path is correctly written in 1C. Even the first Core i3s may well give 40+ parrots, which is quite good, and these are not only parrots, in real work the difference is also noticeable. But! the limitation when working with several (more than 10) users will no longer be the network, here 1 Gbit is still enough, but blocking during multi-user work (Gilev).
- platform 1C 8.3 is many times more demanding for competent network setup. Basic settings - see Gilev, but keep in mind that everything can influence. I saw acceleration from the fact that they uninstalled (and not just turned off) the antivirus, from removing protocols like FCoE, from changing drivers to an older, but microsoft certified version (especially for cheap cards like asus and longs), from removing the second network card from the server . A lot of options, configure the network thoughtfully. There may well be a situation when platform 8.2 gives acceptable numbers, and 8.3 - two or even more times less. Try to play around with platform versions 8.3, sometimes you get a very big effect.
- 1C 8.3.6.2076 (maybe later, I haven’t looked for the exact version yet) over the network is still easier to set up than 8.3.7.2008. From 8.3.7.2008 to achieve normal network operation (in comparable parrots) it turned out only a few times, I could not repeat it for a more general case. I didn’t understand much, but judging by the footcloths from Process Explorer, the recording does not go there the way it does in 8.3.6.
- Despite the fact that when working on a 100Mbps network, its load schedule is small (we can say that the network is free), the speed of work is still much less than on 1 Gbps. The reason is network latency.
- Ceteris paribus (well-functioning network) for 1C 8.2, the Intel-Realtek connection is 10% slower than Intel-Intel. But realtek-realtek can generally give sharp subsidence out of the blue. Therefore, if there is money, it is better to keep Intel network cards everywhere, if there is no money, then put Intel only on the server (your KO). Yes, and there are many times more instructions for tuning intel network cards.
- Default antivirus settings (for example, drweb 10 version) take away about 8-10% of parrots. If you configure it properly (allow the 1cv8 process to do everything, although it is not safe) - the speed is the same as without antivirus.
- Do NOT read Linux gurus. A server with samba is great and free, but if you put Win XP or Win7 on the server (or even better - server OS), then in the file version 1c will work faster. Yes, both samba and the protocol stack and network settings and much more in debian / ubuntu are well tuned, but this is recommended for specialists. It makes no sense to install Linux with default settings and then say that it is slow.
- It's a good idea to test disks connected via net use with fio . At least it will be clear whether these are problems with the 1C platform, or with the network / disk.
- For a single-user variant, I can’t think of tests (or a situation) where the difference between 1Gb and 10 Gb would be visible. The only place where 10Gbps for the file version gave better results was connecting disks via iSCSI, but this is a topic for a separate article. Still, I think that 1 Gbit cards are enough for the file version.
- Why, with a 100 Mbit network, 8.3 works noticeably faster than 8.2 - I don’t understand, but the fact took place. All other equipment, all other settings are exactly the same, just in one case 8.2 is tested, and in the other - 8.3.
- Not tuned NFS win - win or win-lin gives 6 parrots, did not include it in the table. After tuning, I received 25, but it is unstable (the run-up in measurements is more than 2 units). So far I can not give recommendations on the use of windows and the NFS protocol.
terminal server. (the base lies on the server, clients are connected on a network, the RDP protocol). Step by step algorithm:
- We add the Gilev test database to the server in the same folder as the main databases. We connect from the same server and run the test. We remember the result.
- In the same way as in the file version, we set up the processor. In the case of a terminal server, the processor generally plays the main role (it is understood that there are no obvious weaknesses, such as lack of memory or a huge amount of unnecessary software).
- Setting up network cards in the case of a terminal server has practically no effect on the operation of 1s. To provide "special" comfort, if your server gives out more than 50 parrots, you can play around with new versions of the RDP protocol, just for the comfort of users, faster response and scrolling.
- With the active work of a large number of users (and here you can already try to connect 30 people to one base, if you try), it is very desirable to install an SSD drive. For some reason, it is believed that the disk does not particularly affect the operation of 1C, but all tests are carried out with the controller cache enabled for writing, which is wrong. The test base is small, it fits in the cache, hence the high numbers. On real (large) databases, everything will be completely different, so the cache is disabled for tests.
| Raid 10 4x SATA 7200 ATA ST31500341AS | Raid 10 4x SAS 10k | Raid 10 4x SAS 15k | Single SSD | ramdisk | ramdisk | Cache enabled RAID controller |
|
| 21,74 | 28,09 | 32,47 | 49,02 | 50,51 | 53,76 | 49,02 | |
| 1С 8.2 | 21,65 | 28,57 | 32,05 | 48,54 | 49,02 | 53,19 | |
| 8.2.19.83 | 21,65 | 28,41 | 31,45 | 48,54 | 49,50 | 53,19 | |
| 33,33 | 42,74 | 45,05 | 51,55 | 52,08 | 55,56 | 51,55 | |
| 1C 8.3 | 33,46 | 42,02 | 45,05 | 51,02 | 52,08 | 54,95 | |
| 8.3.7.2008 | 35,46 | 43,01 | 44,64 | 51,55 | 52,08 | 56,18 |
- The included cache of the RAID controller eliminates all the difference between the disks, the numbers are the same for both sat and sas. Testing with it for a small amount of data is useless and is not an indicator.
- For the 8.2 platform, the performance difference between SATA and SSD options is more than double. This is not a typo. If you look at the performance monitor during the test on SATA drives. then there is clearly visible "Active disk time (in%)" 80-95. Yes, if you enable the write cache of the disks themselves, the speed will increase to 35, if you enable the raid controller cache - up to 49 (regardless of which disks are being tested at the moment). But these are synthetic parrots of the cache, in real work with large databases there will never be a 100% write cache hit ratio.
- The speed of even cheap SSDs (I tested on Agility 3) is enough for the file version to work. The write resource is another matter, here you need to look in each specific case, it is clear that the Intel 3700 will have an order of magnitude higher, but there the price is corresponding. And yes, I understand that when testing an SSD drive, I also test the cache of this drive to a greater extent, the real results will be less.
- The most correct (from my point of view) solution would be to allocate 2 SSD disks to a mirror raid for the file base (or several file bases), and not put anything else there. Yes, with a mirror, SSDs wear out the same way, and this is a minus, but at least they are somehow insured against errors in the controller electronics.
- The main advantages of SSD disks for the file version will appear when there are many databases, and each with several users. If there are 1-2 bases, and users in the region of 10, then SAS disks will be enough. (but in any case - look at the loading of these disks, at least through perfmon).
- The main advantages of a terminal server are that it can have very weak clients, and the network settings affect the terminal server much less (your KO again).
If the Gilev test shows small numbers, and you have both a processor with a high frequency and fast disks, then here the administrator needs to take at least perfmon, and record all the results somewhere, and watch, observe, draw conclusions. There will be no definitive advice.
Client-server option.
Tests were carried out only on 8.2, tk. On 8.3, everything depends quite seriously on the version.
For testing, I chose different server options and networks between them to show the main trends.
| 1C: Xeon 5520 SQL: Xeon E5-2630 | 1C: Xeon 5520 SQL: Xeon E5-2630 Fiber channel-SSD | 1C: Xeon 5520 SQL: Xeon E5-2630 Fiber channel - SAS | 1C: Xeon 5650 SQL: Xeon E5-2630 | 1C: Xeon 5650 SQL: Xeon E5-2630 Fiber channel-SSD | 1C: Xeon 5650 SQL: Xeon E5-2630 | 1C: Xeon 5650 = | 1C: Xeon 5650 = | 1C: Xeon 5650 = | 1C: Xeon 5650 = | 1C: Xeon 5650 = | |
| 16,78 | 18,23 | 16,84 | 28,57 | 27,78 | 32,05 | 34,72 | 36,50 | 23,26 | 40,65 | 39.37 | |
| 1С 8.2 | 17,12 | 17,06 | 14,53 | 29,41 | 28,41 | 31,45 | 34,97 | 36,23 | 23,81 | 40,32 | 39.06 |
| 16,72 | 16,89 | 13,44 | 29,76 | 28,57 | 32,05 | 34,97 | 36,23 | 23,26 | 40,32 | 39.06 |
It seems that I have considered all the interesting options, if you are interested in something else - write in the comments, I will try to do it.
- SAS on storage is slower than local SSDs, even though storage has large cache sizes. SSDs and local and storage systems for the Gilev test work at comparable speeds. I don’t know any standard multi-threaded test (not only records, but all equipment) except for the load 1C from the MCC.
- Changing the 1C server from 5520 to 5650 gave almost a doubling of performance. Yes, the server configurations do not match completely, but it shows a trend (nothing surprising).
- Increasing the frequency on the SQL server, of course, gives an effect, but not the same as on the 1C server, MS SQL Server is perfectly able (if you ask it) to use multi-core and free memory.
- Changing the network between 1C and SQL from 1 Gbps to 10 Gbps gives about 10% of parrots. Expected more.
- Enabling Shared memory still gives the effect, although not 15%, as described in the article. Make sure to do it, it's quick and easy. If someone gave the SQL server a named instance during installation, then for 1C to work, the server name must be specified not by FQDN (tcp / ip will work), not through localhost or just ServerName, but through ServerNameInstanceName, for example zz-testzztest. (Otherwise, the following DBMS error will occur: Microsoft SQL Server Native Client 10.0: Shared Memory Provider: The shared memory library used to connect to SQL Server 2000 was not found. HRESULT=80004005, HRESULT=80004005, HRESULT=80004005, SQLSrvr: SQLSTATE=08001, state=1, Severity=10, native=126, line=0).
- for users less than 100, the only point of splitting into two separate servers is a license for Win 2008 Std (and older versions), which only supports 32 GB of RAM. In all other cases, 1C and SQL should definitely be installed on the same server and given more (at least 64 GB) memory. Giving MS SQL less than 24-28 GB of RAM is unjustified greed (if you think that you have enough memory for it and everything works fine, maybe the 1C file version would be enough for you?)
- How much worse a bunch of 1C and SQL works in a virtual machine is the topic of a separate article (hint - noticeably worse). Even in Hyper-V, things are not so clear...
- Balanced performance mode is bad. The results are in good agreement with the file version.
- Many sources say that the debug mode (ragent.exe -debug) gives a strong decrease in performance. Well, it lowers, yes, but I would not call 2-3% a significant effect.
1C Test Center 8 is a specialized software product from 1C, which allows you to evaluate the performance of the system and study the bottlenecks of the information system.
Earlier we looked at arbitrary configuration. Now let's learn how to create scenarios for multi-user configuration testing by users and run the testing itself.
The test script in 1C Test Center is written inside a specially created processing. This template is located inside the configuration, it has the name "TTSTemplateTestProcessing". To create your own test script, you need to copy this template and, based on it, create your own, new one, let's call it "Re-delivery of goods receipt":

Let's add a new attribute to the processing and display it on the form - "DocumentToCopy", this is the document that we will copy.
Let's take a closer look at the form module. It can use three procedures - TCIinitialize (), TTSExecute (), Delete ().
- TCIinitialize - used for the initial filling of the infobase settings, for example, filling in the accounting policy.
- TCRun - the main module in which the test script is written directly.
- TCDeleteData is a module that describes the deletion of objects created during testing.

Let's write the simplest code in the TCExecute() procedure, which will copy the selected document 5 times in a row and measure the copying and posting of each document:
For d=1 By 5 Loop
Tools = KipExternalComponent.GetTools();
StartTime = KipExternalComponent.TimerValue(Tools);
Get 267 1C video lessons for free:
CreateDocuments();
EndTime = KipExternalComponent.TimerValue(Tools);
Execution Duration = (EndTime - StartTime) / 1000;
TPWriteIndicator("Execution Time", Execution Duration);
EndCycle;
Return TCExecutionResultSuccessful();
The CreateDocuments() procedure will be executed on the server:
Procedure CreateDocuments()
NewDocument = TCObject.DocumentToCopy.Copy();
NewDocument.Date = CurrentDate();
NewDocument.Write(DocumentWriteMode.Post);
EndProcedure
This completes the preparation of the script, let's move on to the Test Center for load testing.
Setting up 1C Test Center 8.3
After writing the test, let's start setting up the Test Center itself. To set up, you need to fill out a number of directories:
- Processing— a directory containing a list of processing connected to testing. Processing can be both internal and external.
- Roles- a directory for storing a bunch of processing-processing settings. Settings are data that are individual for each test (the number of iterations, the document being copied, etc.).
- Users— list of users and their passwords.
- Computers— list of computers on which the test will be run.
- Clients - setting where, from whom and in what mode load testing will be launched.
Test Scenarios
The main directory that consolidates all the settings in itself: how many times, by which user, on what behalf the load testing will be performed.

Also on the "Parameters" tab there is the ability to configure a technical testing scenario:

After setting up the script, it remains only to run it.
Start testing in 1C: Test Center
When everything is ready, it remains only to start the testing work.
This requires the launch of at least two sessions of the program: the first - in the role of the so-called. "agent", and the second as the initiator of the script launch.
Agent start:

Running the script:

To run it, simply select the desired script from the list and click the Run button.
Products for accounting and management accounting of 1C company are most common in the territory of the Russian Federation. Thousands of companies conduct their business based on standard and specialized 1C configurations. With such massive use, a number of questions regularly arise about optimizing the budget for software and the reasonable use of resources. Disputes around the server parts of this complex do not subside, in particular, on which operating system to base the 1C server and which DBMS to entrust the processing of 1C databases. During our tests, we will try to answer these questions.
Test participants
MS Server operating system and MS SQL DBMS
- The 1C company openly positions this bundle as the main working model, respectively, 1C products are created primarily for it.
- Presence of the protocol of direct high-speed exchange of information SharedMemory
- There is official technical support and service contracts
- There is a knowledge base and tons of information on installation and fine-tuning of 1C + MS SQL
Unix operating system and PostgreSQL DBMS
- The system is completely free (except for the license for the 1C:Enterprise server)
- It is possible to flexibly configure many parameters that improve the performance of the DBMS
- Declared support for PostgreSQL DBMS by 1C products
- Possibility of database replication
Of course, the cost of the project, fault tolerance and technical support are important criteria when choosing an information system for 1C. However, there is a factor that in most cases dramatically affects the decision-making - this is speed.
Since the technical literature on these two systems on the Internet is simply great, one could argue for a long time about long comparative tables that, depending on the goals, emphasize the benefits of one or another product. You can discuss this or that parameter among hundreds of others of the same kind - how unique it is in its kind and how it affects the achievement of the result. But theory without practice is dead - we propose to omit the theory in this article and go directly to the facts in order to test the performance of both information systems in practice with a certain level of recommended settings and in various server architecture options (see Table 2).
Test Methods
In our tests, we will rely on two methods of synthetic load generation and imitation of user work in 1C. This is the Gilev test (TPC-1C) and a special test 1C "Test Center" from the 1C: KIP toolkit with special user scenarios.
Gilev test (TPC-1C)
Gilev test belongs to the section of universal cross-platform load tests. It can be used for both file and client-server 1C:Enterprise architecture. The test measures the amount of work per unit of time in one thread and is suitable for assessing the speed of single-threaded workloads, including the speed of drawing the interface, the impact of resource costs, reposting documents, month-end procedures, payroll, etc. Versatility allows you to make a summary assessment of performance without being tied to a single platform configuration. The result of the test is a total assessment of the measured 1C system, expressed in arbitrary units.
A specialized test from the Test Center toolkit 1C: KIP
Test center- a tool for multi-user load testing of systems based on 1C: Enterprise 8 (see Figure 1). With its help, you can simulate the work of the company without the participation of real users, which allows you to evaluate the applicability, performance and scalability of the information system in real conditions. The system is a configuration that provides a mechanism for managing the testing process. To test an infobase, it is necessary to integrate the Test Center configuration into the configuration of the tested database by comparing and merging configurations. As a result of the merging, objects and common modules necessary for the operation of the Test Center will be added to the metadata of the database under test.
Figure 1 - Scheme of work "Test Center" 1C: instrumentation
Thus, using the 1C: instrumentation toolkit, based on the available data in real production bases 1C - the programmer generates a full-fledged automatic testing scenario based on a list of documents and reference books that are key for this type of configuration (request for spending funds, ordering a supplier, selling goods and services, etc.). When you run the scenario, the Test Center will automatically play the multi-user activity described in the scenario. To do this, the Test Center will create the required number of virtual users (in accordance with the list of roles) and start the execution of actions.
Test Options
When setting up test scenarios to reliably simulate the simultaneous work of a large number of users, certain test parameters are set for each type of document (see Table 1):
- Document - indicates a specific document in the working database, on the basis of which load testing will be performed
- Run priority - forms the order in which tests are run for each type of document
- Number of documents - determines the volume of generated test documents
- Pause, seconds - delay when starting a series of tests within the same document type
- The number of lines in the document is an information pointer that reports the “massiveness” of the test document, which affects the processing time and the load on resources
Tests are performed in 3 iterations, the results are recorded in a table. Thus, the obtained test results, measured in seconds, most realistically and objectively reflect the level of performance of 1C bases in conditions as close as possible to real ones (see Tables 3.1 and 3.2).
Table 1. Test script parameters
| Document | Start Priority | Number of documents | Pause, seconds | Number of lines in document | |
| Role 1 | Buyer invoice | 1 | 25 | 51 | 62 |
| Receipt of goods | 2 | 25 | 80 | ||
| Sale of goods | 3 | 25 | 103 | ||
| Money orders | 4 | 25 | 1 | ||
| Buyer Returns | 5 | 25 | 82 | ||
| Role 2 | Buyer invoice5 | 10 | 65 | 79 | |
| Receipt of goods | 1 | 22 | 80 | ||
| Sale of goods | 2 | 25 | 103 | ||
| Money orders | 3 | 25 | 1 | ||
| Buyer Returns | 4 | 25 | 75 | ||
| Role 3 | Buyer invoice | 4 | 15 | 45 | 76 |
| Receipt of goods | 5 | 26 | 80 | ||
| Sale of goods | 1 | 52 | 103 | ||
| Money orders | 2 | 26 | 1 | ||
| Buyer Returns | 3 | 32 | 90 | ||
| Role 4 | Buyer invoice | 3 | 45 | 38 | 70 |
| Receipt of goods | 4 | 30 | 80 | ||
| Sale of goods | 5 | 30 | 103 | ||
| Money orders | 1 | 20 | 1 | ||
| Buyer Returns | 2 | 20 | 86 | ||
| Role 5 | Buyer invoice | 2 | 30 | 73 | 76 |
| Receipt of goods | 3 | 30 | 80 | ||
| Sale of goods | 4 | 30 | 103 | ||
| Money orders | 5 | 18 | 1 | ||
| Buyer Returns | 1 | 18 | 91 | ||
| Role 6 | Buyer invoice | 1 | 40 | 35 | 86 |
| Receipt of goods | 2 | 40 | 80 | ||
| Sale of goods | 3 | 40 | 103 | ||
| Money orders | 4 | 40 | 1 | ||
| Buyer Returns | 5 | 40 | 88 | ||
| Role 7 | Buyer invoice | 5 | 25 | 68 | 80 |
| Receipt of goods | 1 | 25 | 80 | ||
| Sale of goods | 2 | 25 | 103 | ||
| Money orders | 3 | 25 | 1 | ||
| Buyer Returns | 4 | 25 | 90 | ||
| Role 8 | Buyer invoice | 3 | 25 | 62 | 87 |
| Receipt of goods | 4 | 25 | 80 | ||
| Sale of goods | 5 | 25 | 103 | ||
| Money orders | 1 | 25 | 1 | ||
| Buyer Returns | 2 | 25 | 92 | ||
| Role 9 | Buyer invoice | 2 | 20 | 82 | 82 |
| Receipt of goods | 4 | 20 | 80 | ||
| Sale of goods | 5 | 20 | 103 | ||
| Money orders | 1 | 20 | 1 | ||
| Buyer Returns | 3 | 20 | 98 | ||
| Role 10 | Buyer invoice | 4 | 50 | 2 | 92 |
| Receipt of goods | 1 | 50 | 80 | ||
| Sale of goods | 2 | 50 | 103 | ||
| Money orders | 5 | 50 | 1 | ||
| Buyer Returns | 3 | 50 | 98 |
Table 2. Specifications of the test bench
| №p\p | The role of the system | CPU\vCPU | RAM, GB | Disk I/O system |
| 1 | Terminal Server- virtual machine for test management | 4 cores 2.9GHz |
16 GB | Intel Sata SSD Raid1 |
| 2 | Scenario 1. Server 1C + DBMS hardware | Intel Xeon E5-2690 16 cores |
96 GB | Intel Sata SSD Raid1 |
| 3 | Scenario 2. Server 1C + DBMS virtual | 16 cores 2.9GHz |
64 GB | Intel Sata SSD Raid1 |
| 4 | Scenario 3. Server 1C virtual | 16 cores 2.9GHz |
32 GB | Intel Sata SSD Raid1 |
| 5 | Scenario 4. DBMS server virtual | 16 cores 2.9GHz |
32 GB | Intel Sata SSD Raid1 |
| 6 | Software |
|
||
| 7 | Configurations 1C |
|
||
Table 3.1 Test results with Gilev's test (TPC-1C). The highest value is considered optimal.
Table 3.2 Test results using a special test 1C: KIP. The smallest value is considered optimal.
| Microsoft Server operating system | Unix class operating system | |||||
| List of tests (average value based on the results of a series of 3 tests) | Hardware server 1C + DBMS, SharedMemory protocol | Virtual server 1C + DBMS, SharedMemory protocol | 1C hardware server and DBMS hardware server, TCP-IP protocol | 1C virtual server and DBMS virtual server, TCP-IP protocol | ||
| Carrying out 1C: KIP tests on an existing database, configuration Accounting Enterprise | ||||||
| Turnover balance sheet | 1.741 sec | 2.473 sec | 2.873 sec | 2.522 sec | 13.866 sec | 9.751 sec |
| Carrying out the return of goods from buyers | 0.695 sec | 0.775 sec | 0.756 sec | 0.781 sec | 0.499 sec | 0.719 sec |
| Processing payment orders | 0.048 sec | 0.058 sec | 0.063 sec | 0.064 sec | 0.037 sec | 0.065 sec |
| Conducting PTIS | 0.454 sec | 0.548 sec | 0.535 sec | 0.556 sec | 0.362 sec | 0.568 sec |
| Carrying out the sale of goods and services | 0.667 sec | 0.759 sec | 0.747 sec | 0.879 sec | 0.544 sec | 0.802 sec |
| Posting an invoice for payment | 0.028 sec | 0.037 sec | 0.037 sec | 0.038 sec | 0.026 sec | 0.038 sec |
| Calculation of cost estimates | 3.071 sec | 3.657 sec | 4.094 sec | 3.768 sec | 15.175 sec | 10.68 sec |
| Carrying out 1C: KIP tests on the existing base, Trade Management configuration | ||||||
| Carrying out and returning from the client | 2.192 sec | 2.113 sec | 2.070 sec | 2.418 sec | 1.417 sec | 1.494 sec |
| Carrying out and returning goods to the supplier | 1.446 sec | 1,410 sec | 1.359 sec | 1.467 sec | 0.790 sec | 0.849 sec |
| Posting a sales order | 0.355 sec | 0.344 sec | 0.335 sec | 0.361 sec | 0.297 sec | 0.299 sec |
| Carrying out a recount of goods | 0.140 sec | 0.134 sec | 0.131 sec | 0.144 sec | 0.100 sec | 0.097 sec |
| Carrying out the receipt of specifications | 1,499 sec | 1.438 sec | 1.412 sec | 1.524 sec | 1.097 sec | 1.189 sec |
| Carrying out the implementation of TS | 1,390 sec | 1.355 sec | 1.308 sec | 1.426 sec | 1.093 sec | 1.114 sec |
| Carrying out RKO | 0.759 sec | 0.729 sec | 0.713 sec | 0.759 sec | 0.748 sec | 0.735 sec |
- In a special test 1C, the operations of "reading data and complex calculations", such as "Turnover balance sheet" and "Calculation of cost estimates" are several times faster on the MS SQL DBMS from Microsoft.
- In the operations of "writing data and posting documents" in most tests, the PostgreSQL DBMS, optimized for 1C, shows the best result.
- Gilev's synthetic test also shows the advantage of PostgreSQL. This fact is connected with the fact that the synthetic test is based on measuring the speed of creating and posting certain types of documents, which is also considered to be the operations of “data recording and document posting”.
Let's finish with cross-platform comparison, let's move on to comparisons within each system:
- As expected, 1C tests on a hardware platform show better results than on a virtual one. The difference in the results of the special 1C test in both cases is small, which indicates the gradual optimization of virtual hypervisor manufacturers.
- It is also expected that the use of shared memory technology (SharedMemory) speeds up the process of data exchange between the 1C server and the DBMS. Accordingly, the test results are slightly better than those of the scheme with network interaction of these two services via the TCP-IP protocol.
We can conclude that with the correct setting of 1C and DBMS, you can achieve significant results even on free software. Therefore, when designing a new IT structure for 1C, it is necessary to take into account the level of load on the system, the type of prevailing operations in the database, the available budget, the presence of a specialist in non-standard DBMS, the need for integration with external services, etc. Based on these data, it is already possible to select the required solution.
Read on for testing.
Current version: 2.0.011. Version history here: versions.php
You can download it here: http://infostart.ru/public/173394/ or here: perfomanceTest.cf
The test allows you to measure the performance of the link 1c server - DBMS server in various versions in multi-threaded operation. The test takes 20-30 minutes.
Don't run the test on the server that the users are currently working on or they'll get sad! The test gives a very big load!
The test results can be viewed as a report inside the configuration.
Load test TPC-1C Gilev
It is also possible to share results with other people who have completed the test using the Share Results processing. After the exchange, it will be possible to compare your results with the results of other people.
More detailed instructions, as well as a discussion of the test, can be found at http://infostart.ru/public/173394/.
There are 751 results in the database, last updated on 2018-06-15 06:33:26. The results can be viewed by downloading the test and running the results exchange, or (in a simplified form) here: results.php
Statistics
Version 1.x results: index_old.php
Charting uses c3js and d3js (c3js depends on it).
| heavenly 20.02.13 — 15:59 |
|
| smitru 1 — 20.02.13 — 16:00 |
|
| ansh15 2 — 20.02.13 — 16:08 |
(0)Old theme |
| heavenly 3 — 20.02.13 — 16:14 |
Xeon X3450 2.67GHz |
| Adimr 4 — 20.02.13 — 16:21 |
|
| smitru 5 — 20.02.13 — 16:34 |
|
| heavenly 6 — 20.02.13 — 16:43 |
|
| Idea? 7 — 20.02.13 — 16:44 |
Use the RAID controller built into the motherboard? Performance testing 1COr buy external? |
| smitru 8 — 20.02.13 — 16:45 |
|
| Fragster 10 — 20.02.13 — 16:49 |
Gilev test single-threaded |
| Fragster 11 — 20.02.13 — 16:50 |
|
| heavenly 12 — 20.02.13 — 16:51 |
|
| Demiurge 13 — 21.02.13 — 07:30 |
|
| el-gamberro 14 — 21.02.13 — 08:05 |
|
| heavenly 15 — 21.02.13 — 09:47 |
|
| heavenly 16 — 21.02.13 — 09:49 |
Put things in order in your work using the configuration 1C "IT Department Management 8"
ATTENTION! Ctrl-F5 or ctrl-r
2000
Human.
background
A mandatory operation for any implementation or modification of an existing information system is to assess the required speed of the system and plan the necessary computing resources for its implementation. At present, there is no exact solution to this problem in a general form, and if, despite
its complexity and cost, such an algorithm will be proposed by some manufacturer, then even small changes in hardware, software version, system configuration, or the number or standard behavior of users will lead to significant errors.
However, there are plenty of ways to evaluate the software and hardware configuration required to achieve the desired performance. All of these methods can be used in the selection process, but the consumer must understand their scope and limitations.
Most of the existing performance evaluation methods are based on
or other type of testing.
There are two main types of testing:
component and integral.
Component testing is carried out
testing of individual components of the solution, starting from performance
processors or storage subsystems before testing
performance of the server as a whole, but without the payload in the form of one or another
business applications.
Stress Testing
The integral approach is characterized by the assessment
performance of the solution as a whole, both its software and hardware parts.
In this case, it can be used as a business application that will be used
in the final solution, as well as some model applications that emulate
some standard business processes and workloads.

Tests TPC and other universal tests allow you to choose the most promising platforms and compare offers from different manufacturers, but they are only reference information that does not take into account the specifics of your business. Specialized tests allow you to more accurately select a specific server model and its configuration. However, the most informed decisions are made only on the basis of the results of load tests. Only they allow you to optimally configure the selected
server platform and tune it for maximum performance.
What's happened TPC-1C-GILV
This is a series of independent tests designed to evaluate the performance of the 1C:Enterprise 8.1 platform on your computer(s).
Of course, an "independent" test means that it is not sponsored by 1C.
Test is currently available TPC-A-local Throughput/ TPC-1C-GILV-A" (last updated August 2008 version 1.0.3)
test idea TPC-A-local Throughput/ TPC-1C-GILV-A
You download the configuration upload file (~400 Kb) from this site and upload it to your site. If you deploy the configuration in file options, then to a large extent the test will test the "CPU of your computer - HDD where the base lies" link.
If you expand the configuration into a client-server variant, then the CPU of the application server - the CPU of the server of the subd - HDD - of the server of the subd will be mainly subjected to the load.
The test intensively writes 5,000 documents. There is no deep meaning in the business logic of the code, it is simply the performance of the document X conditionally chosen as the standard that is evaluated.
The main beauty of the test is that you do not need to know the technical details. The test is self-executing and gives a score. In addition, you don’t have to tell the result to whom either 🙂
You can compare the performance of several servers, or one server with different disk subsystem characteristics.
By performing a test from the application server and from the client over the network, you can understand the impact of the network from the client to the server.
How to run a test
Running a test is very easy. Gotta push the button
and wait until the test indicator (to the right of the button) reaches 100%.
The test usually takes about 8 minutes.
What do test results mean
The test result is presented as the "write rate" of the test data. The error of the test is 2 units. For an accurate assessment, you can repeat the test 3 times.
After the test indicator reaches 100%, you will see graphs like this:

Below the graphs are some previous similar tests.
The color of the graph hints at the current quality of the "total" performance for work without taking into account locks.

The green color of the graph, together with some indicators on the right, conditionally chosen as benchmarks, allows us to make a cross-platform generalized assessment of "good" performance 🙂
How to enjoy test results
As a result, you received a certain performance index (consider speed). It doesn't matter if the result is good or bad, it is the result of the PLATFORM running on your hardware. In the cases of the client-server version, this is the result of a complex chain of passing requests through various sections. You get the overall actual result, which is determined by the BOTTOM POINT in the system. THE BOTTLE PLACE IS ALWAYS!
In other words, both DBMS settings, OS settings, and equipment affect the overall team result 🙂
Which server is better
This test, performed on a specific server, gives a result on a combination of hardware settings, operating system, subd, etc. However, a high score on a particular server hardware means that, under normal conditions, the same result will be on identical server hardware. This test is a free help in the ability to compare the installation of 1C:Enterprise under Windows and Linux, three different DBMS supported by the 1C:Enterprise 8.1 platform.
Test safety
The test is absolutely safe. It does not lead to a "fall" of the server (there is no "stress" algorithm) and does not require preliminary measures even on a "combat" server. Confidential data is also not recorded in the test results. Collects information about the parameters of the CPU, RAM, HDD. Device serial numbers are not collected. All this can be easily verified - the test code is 100% open. No transfer of information without your knowledge is possible.
How to post test results
If you want to help develop the test, you can run a number of tests on your servers. Then leave the general list of tests done only those that you want to publish and send the dt-upload with the results.
The data will be manually checked (that they are not erroneous), the addressee of the tests is added to the column "author" of the tests and added to the upload, available for download to everyone.
Classification TPC-A-local Throughput/ TPC-1C-GILV-A
The test belongs to the section of universal integral cross-platform tests. Moreover, it is applicable for file and client-server variants of 1C:Enterprise operation. The test works for all DBMS supported by 1C.
Universality allows you to make a generalized assessment of performance without being tied to a specific typical platform configuration.
On the other hand, this means that for accurate calculations of a custom project, the test allows you to make a preliminary assessment before specialized load testing (for example, using 1C: Testcenter).
Note. Test modification " A" means "automatic lock management". After the release of official versions of standard solutions from 1C, it is planned to modify the test to work in the "managed locks" mode and designate it with the letter " M".
Download test
This test is not commercial and is available for free download.
Test results

Top - 3 best 1C client-server installations on MS SQL Server. You too can get into this table. You can see the results in more detail by downloading the test.
Technical details
What happens in the test within the "one" cycle of the operation?
An example of executing sql commands can be found in the attached file.
How to measure the workload of iron
It should be noted that the test itself already partially performs the measurement. For a more detailed picture, I recommend using Mark Rusinovich's Process Explorer utility.

The figure shows an example of a measurement for the file version.
Contacts for TPC-1C-GILV
http://gilev.ru/1c/ tpc
test results, suggestions for development
and send feedback by e-mail: [email protected]
Go to other materials of the site
| heavenly 20.02.13 — 15:59 |
There is a server on CentOS 6.3 with 64-bit Postgresql 8.4, it also has a 32-bit server 1C 8.2.16.368 *there was no money for a 64bit key* I downloaded Gilev's test as a file dt. I tried to change the Compatibility Mode, Data Lock Management Mode in this database - the same result. Or should this test be run on the server itself? |
| smitru 1 — 20.02.13 — 16:00 |
(0) Gilev has his own forum. Have you tried asking a question there? |
| ansh15 2 — 20.02.13 — 16:08 |
(0)Old theme |
| heavenly 3 — 20.02.13 — 16:14 |
Xeon X3450 2.67GHz |
| Adimr 4 — 20.02.13 — 16:21 |
(0) http://infostart.ru/public/147259/ |
| smitru 5 — 20.02.13 — 16:34 |
(3) "in a soft mirror raid" Afiget … and after that there are complaints about the brakes???? |
| heavenly 6 — 20.02.13 — 16:43 |
(5) like a soft raid gives a very small overhead... but what do you propose to do? Use the RAID controller built into the motherboard? Or buy external? |
| Idea? 7 — 20.02.13 — 16:44 |
Use the RAID controller built into the motherboard? Or buy external? |
| smitru 8 — 20.02.13 — 16:45 |
(6) hardware is better (only it gives real reading acceleration and does not slow down writing like software) And so - you need to spread the data files, system, page file, tempo db ON DIFFERENT MIRRORS (the latter do not put too much mirrors, but it is useful on separate devices) |
| Fragster 10 — 20.02.13 — 16:49 |
Gilev test single-threaded |
| Fragster 11 — 20.02.13 — 16:50 |
(5) it is the mirror raid (1 and 10) that slows down a little |
| heavenly 12 — 20.02.13 — 16:51 |
(7) Based on these considerations, a soft raid was chosen. (8) thanks for the comment, but... this server is in a small company with 5-10 users with a small number of documents per day. How justified is the spacing of files across disks, and even the purchase of new disks? |
| Demiurge 13 — 21.02.13 — 07:30 |
(1) why ask the experts who do productivity every day when there is mista? :))) |
| el-gamberro 14 — 21.02.13 — 08:05 |
I also did not understand what this wearing to 1C has? |
| heavenly 15 — 21.02.13 — 09:47 |
(14) as if the topic is in the IT section, and not 1C. |
| heavenly 16 — 21.02.13 — 09:49 |
It remains only to remember where I read about it ... |
TurboConf 5 - expanding the capabilities of the 1C Configurator
ATTENTION!
If you have lost the message input box, click Ctrl-F5 or ctrl-r or the Refresh button in the browser.
The topic has not been updated for a long time, and was marked as archived. Adding messages is not possible.
But you can create a new thread and you will definitely get an answer!
Every hour there are more than 2000
Human.