The purpose of the “Settings Storage” configuration object is clear from the name - to store various user settings. The scope of application of this object is wide - in any configuration, however serious, it is necessary to store some user settings.
For the convenience of programmers, in each configuration there are several standard settings stores; in addition, it is possible to create as many additional settings stores as needed.
First, let's look at the standard settings stores that are present in any 1C configuration starting from version 8.2.
Standard settings stores
So, by default, the configuration contains the following settings stores:
- Report Options Storage - to access the settings of report options.
- Storage of Custom Report Settings - for accessing custom report settings.
- Form DataSettings Storage - for accessing user settings for form data.
- General Settings Storage - for accessing general settings.
- SystemSettings Storage - for accessing system settings.
- Storage of UserSettings of Dynamic Lists - for accessing user settings of dynamic lists.
Each of these stores can be accessed as a property of the global context.
The programmer can use standard storage for his own needs, saving various settings in the context of the user, object and the setting itself.
To work with settings repositories (both standard and those added by the programmer), the following methods are used.
Recording and receiving settings:
GeneralSettings Storage.Save(ObjectName,SettingsName,SettingsValue,SettingsDescription,UserName); SettingsValue = GeneralSettings Storage.Load(ObjectName, SettingsName, SettingsDescription, UserName);
Removing redundant/unnecessary settings:
GeneralSettings Storage.Delete(ObjectName,SettingsName,UserName);
Getting a list of settings:
SettingsValueList = GeneralSettings Storage.GetList(ObjectName, UserName);
The parameters “ObjectName”, “SettingsName” and “UserName” must be of string type.
In the database, all settings are stored in a separate table.
Settings repositories created by the programmer
Now let's talk about those settings repositories that are created by the programmer. In general, the programmer is not limited in any way in his desire to create a new settings store, but usually separate settings stores are created for the following reasons:
- it is necessary to move settings between databases;
- reference control is required when storing settings;
- a special structure of 1C settings is required.
Settings stores are added in the corresponding configuration section.
A key feature of settings stores created by the programmer is the need to manually implement methods for writing and retrieving values (Save() and Load()). In these methods, the programmer must describe saving (in information registers, files, directories, etc.) and loading settings using the built-in language.
Otherwise, the principles of working with the created repository are practically no different from working with standard settings repositories.
The created repository can be accessed this way:
Settings Storage.StorageName.Load();
In addition, the created storages can replace the standard ones in various configuration objects and in the configuration itself.

Managed forms have two properties:
- Automatic saving of data - if the “Use” value is selected, the data will be saved automatically to the standard storage of form data settings;
- Saving data in settings - if the “Use list” value is selected, then the “Saving” column will appear in the form details window, with which you can specify which form details should be saved, and you will also be able to select the settings storage for this data.

That's all, I hope this article helped you.
User settings in 1C are usually divided into three parts.
Firstly, the 1C platform allows each user to make their own 1C settings for convenience. For example, settings for 1C SKD reports.
Secondly, in each typical and non-standard configuration there are usually many processing units that perform service actions. Processing requires adjustment. It's a shame to waste time re-entering settings every time you open processing.
And finally, thirdly, for the programmer himself, in order for the program to be universal, it is better not to write some default values in the program code, but to store them in some settings.
Where to store all these settings in 1C?
How 1C settings were saved before
The platform offered the following standard option:
- When it is necessary to remember the 1C setting, the programmer uses the function
SaveValue("SettingsName", Value); - To read the 1C setting, use the function
Value = RestoreValue("SettingName", Value);
Accordingly, the programmer creates buttons for saving and restoring 1C settings, and the user uses this mechanism (or the programmer saves them automatically).
As a value, you can use not only a number or a string, but also, for example, a Structure - a type that allows you to store many values with their names, for example:
Settings = New Structure();
Settings.Insert("SettingsName", Value);
Value = Settings.SettingsName;
The 1C settings are saved for the user who pressed the programmer-designed button to save 1C settings (or under whom these actions were performed automatically). 1C settings are stored in a text file in the folder with the database (when using a file database).
Also, the programmer was free to develop his own arbitrary methods for storing 1C settings using conventional methods - for example, by working with text and XML files - saving 1C settings in an arbitrary manner to a file.
In typical configurations, 1C report settings were saved to the information register. And the settings for 1C SKD reports can be saved to an XML file.
Standard storage of 1C settings
All these features remain in the new platform 8.2, but finally a certain “standard method” of saving settings has appeared - 1C Settings Storage.
The mechanism is divided into two parts - standard and custom 1C settings storages. The standard one is implemented in the 1C platform, the custom one is a 1C object that is created and programmed by the programmer.
The standard 1C settings storage is used by the platform by default in the thin client to save the user's 1C settings in the following platform mechanisms:
- Command managed interface
- Forms
- Report settings and options.
A programmer can use the standard 1C settings storage from program code in the 1C language in a manner similar to what was done before:
- When you need to remember a setting
GeneralSettings Storage.Save("ObjectName", "SettingsName", Value); - To read the setting
Value = GeneralSettings Storage.Load("ObjectName", "SettingsName", Value); - To get a list of settings
List = GeneralSettings Storage.GetList("ObjectName");
1C settings are saved directly in the database, in special tables.
As you can see, compared to the old mechanism, an additional section has been added - the name of the object. Platform, when automatically saving, the name of the 1C object is used in the metadata indicating the type, for example:
Report.Sales
It is also possible to manage the user name for which 1C settings will be saved, specifying it as the last parameter.
There are the following standard 1C settings storages:
- System Settings Storage
- General Settings Storage
- FormsDataSettings Storage
- Storage of UserSettings of Reports and Storage of Report Options.
1C settings storage
The programmer can create his own settings storage in the configurator.
This is supposed to be done in the following cases:
- Reference control when storing 1C settings
- Migration of 1C settings when using
- Special structure of 1C settings (for automatic compliance)
- Overriding standard storages.
To create your own 1C settings storage, you need to add one in the configurator in the configuration window in the General/1C settings storage branch.
You can override the standard 1C settings stores used by the platform in the configuration properties (the root branch of the configuration, which programmers usually call Root or Head).
If there is an empty line in the properties, the standard 1C settings storage is used, otherwise, the selected one is used, and the standard one is not used.

It is possible to use the storage automatically:

In a thick client, to use it, you need to write a direct call to save 1C settings in the 1C language code:
Settings Storage.StorageName.Save();
When adding your own 1C settings storage to the configuration, you need to write handlers for loading and saving values in the 1C language, otherwise the storage will not work.
Actually, in these functions you yourself write the code for saving the value (in a standard storage or in a file or in a directory or in an information register, etc.), and loading the value.
Quite often, working with 1C and dealing with user problems, I discover that they do not know how to use basic techniques to make their daily work easier. One such technique is saving settings. If standard reports usually have this feature built-in, when developing their reports, programmers often forget about this feature, although it is implemented quite simply. In this article, we will try to consider what capabilities the system provides for saving settings from the programmer’s perspective.
For many people, two functions will be enough: SaveValue(<Имя>, <Значение>) and its pair RestoreValue(<Имя>) . but this is only for the fat client. If you read the help, you can see that the setting is saved for the base-user pair. We must not forget that you can save not only simple data types, but complex ones, for example, a structure or even a table of values.
Programmers also used the functions ValueVFile(<ИмяФайла>, <Значение>) and ValueFromFile(<ИмяФайла>).
Starting from version 8.2, I won’t tell you the exact release; the “Settings Storage” branch appeared in the metadata tree, which needs to be described in more detail.
The mechanism can be divided into two parts: standard mechanism and custom mechanism.
In the thin client, the mechanism for saving settings is activated by default and is accessible through the “All actions” button
By default, the system allows you to save settings for several objects: managed interface settings, report settings, form settings.
Programmatically accessing the settings is still simple, the syntax has changed a little.
And restore accordingly
General Settings Storage.Load(<КлючОбъекта>, <КлючНастроек>, <ОписаниеНастроек>, <ИмяПользователя>)
All parameters are described in detail in the help.
When writing external reports, you must remember to use the ability to automatically save data, so that the user, once he has configured the report or processing, does not return to these settings again.
First, in the form we will indicate the ability to save the values of processing details and form details, we will indicate the values of which details we want to save.

It is also advisable to check the box next to Restore values when opening.
After running the report and showing the user how to use it, you need to remember to tell him about the ability to save form settings, as well as about auto-recovery when opening the form in the future:

The mechanisms are simple but effective, the user will be grateful to you.
Rating: / 0
Today we will talk about settings in reports in “1C:Enterprise” 8.2 or 8.3, using the example configuration 1C:Enterprise 8. Trade management for Ukraine
Update
We have supplemented the article with settings for configuration on managed forms and wrote about some tricks for setting up reports in 1C:Enterprise 8. Trade management for Ukraine, ed. 3.1 (managed forms)
Let's look at how using an example configuration Trade management for Ukraine
You can easily and quickly customize the report exactly to your requirements.
Managed forms mean that the appearance of reports can be customized to suit you. After all, previously, if a user wanted to change report settings, he had to ask the programmer to “finish” the reports he needed. Now you can customize any report yourself without the help of a programmer.
Report settings in 1C:Enterprise 8. Trade management for Ukraine, ed. 3
To configure the report, click on the button Settings. A window with settings opens in front of us.

To see all (advanced settings), click All actions → All settings

In this window we can add the fields we need, group fields, make selections, and much more.

In the period line – we can choose for which period we want to see data.
Selected fields – here you can add missing fields

On the selection tab we can select only those elements that you need to see.
Types of comparison:
- Equals– You can only select one value
- Not equal- value for which you do not want to see data
- On the list– if you want to select several values
- In a group from the list- you can select a list of several data groups.
- Not on the list- selection of a list of positions that should not be included in the report
- Not in list group– excluding the list of data groups from the selection
- In Group– in this case you will see data for only one group/category
- Not in group- data group exclusion
For example, in a list of goods in warehouses, we want to see all the goods that we have in stock. To do this, set the Final balance selection to greater than 0.

Now our report looks like this:

On the sorting tab we can sort our data.
For example, we want to sort our products alphabetically. To do this, go to the sorting window. And simply drag the “Nomenclature” attribute to the right side of the window and set the sorting direction to “Ascending”.

The report started to look like this:

On the Grouping tab we can group data by some value. For example, we want to see our balances in terms of warehouses. Everything is simple here: we click on the three dots, go to the editing groupings window and add a new “Warehouse” grouping and select the “Hierarchy” type.


We will also group by month, that is, we will find out in which month we received the goods.
To do this, add the following grouping: Period month (it is also possible to group by years, quarters, days)

Now let's look at the appearance of our report:

As you can see, in the settings we have doubled the grouping by warehouses. How can we find out where the extra group came from? Since in managed forms you can design a report yourself, so let’s go into the report structure itself. To do this we go to

We see the structure of the report:

That is, the report is structured as follows: first there is grouping by warehouses, then subgroups: grouping by Nomenclature, characteristics, series and units of measurement, after which there is grouping by movement documents, and the last independent grouping is unit of measurement
If we simply disable the Warehouse checkbox, then 2 groups will be disabled: item and registrar. Therefore, we simply “grab” the Nomenclature line and drag it into the Report. Uncheck warehouse. Now the structure of our report should look like this:

Now the report looks nice:

On the item fields tab, we can select only those fields that we want to see in the report. For example, in the List of goods in warehouses report, we want to see the article number of the item, the name of the item, the characteristics of the item, units. measurements. To do this, go to the Item Fields tab and set all the above listed details. Also, in order for the name of the item and its characteristics to be in one column in the report, it is necessary to place these details in one group (as shown in the figure).

Using the Conditional Appearance tab, we can also make our report in color. For example, we want to quickly find the quantity of a product in a certain warehouse. To do this, highlight a specific warehouse with color:
On the Condition tab, select the warehouse that we want to “paint”. Warehouse = Groceries Store

On the design tab, select which color (choose yellow):

On the Formatted fields tab we can see which fields/columns we will change in color. If we leave this tab empty, the program will color in yellow everything related to the “Products Store” warehouse.

Now let’s create our report!
Now it looks like this:

First we see grouping by warehouses, then grouping by month.
You can switch between settings thanks to a button like - Select settings:


Our setting is currently available only to us, but if we want to add it to other users, then we need to go to the section Administration → User and rights settings → Copying settings

On the Report Settings tab we see all the reports whose settings we saved, and now we select our setting.
Now all we have to do is copy and close.


There is one more trick with reports on managed forms: you can add columns and rows in a slightly different way.
Let's go through All actions → Change report variant
The following window opened before us:

Here we can also group, sort, add columns/rows. In general, everything your heart desires.
And using the example of the Gross Profit report, I will show how you can add the Markup column.
We also go to settings via All actions → Change report variant.

In the window that appears, write the name of our column: Markup.
In the Expression of total records field, enter the formula: Revenue/Total*100 – 100

On the left we find a folder called Custom Fields and see the newly created Markup
Add it to the right column

Now let’s add our markup to the report structure: Organization and Divisions:

And let's finish editing.
Let's generate a report.

We see that a new column has appeared, but to put it mildly, we are not satisfied with the number of decimal places. But this is also very easy to fix.
We need to return to the settings, namely to the Custom Fields tab, and edit our formula. The number format we want to see is 2 decimal places.
We make the following formula: Format(Revenue / Total * 100 - 100, “NAV = 2”)

Let's generate the report again.

Now we see that everything is in order!
But it happens that an error pops up: “Division by zero.” To avoid such an error, let's write the formula as follows:
Choice
When Total<> 0
Then Format(Revenue / Total * 100 - 100, “NAV = 2”)
Otherwise 0
End
We can also add a new plate to our report. To do this, we also go to Change report version. Further Add → New Table.

Now let's add rows and columns.
Let's say we want to see gross profit only for the Household Appliances segment.
Let's add the following groupings to the lines: Nomenclature.
On the Selection tab, enable the “Current item has its own selection” checkbox and add items from the household appliances group.
On the Fields tab, also enable the checkbox “The current element has its own settings for the selected fields” - Nomenclature.
In the structure of our table, namely columns, we add a new grouping, leaving the field empty.


Let's call our table: Household Appliances. To do this, go to the Table and on the Additional Settings tab, enter a title (as shown in the figure below).

Now let's generate a report.

Our new sign was included in the gross profit report.
Everything is elementary!
Report settings in 1C:Enterprise 8. Trade management for Ukraine, ed. 2.3
Reports in 1C:Enterprise are a constructor, but not every user knows about the intricacies of report settings.

We set up reporting, click the Save settings button on the report panel, Create a new one, write the name of the report. If you want this report to open when opened, check the Open column.
In order to open the required report setting, click on the Restore Settings button and double-click the desired setting. Don't forget to click the Generate button.
2. How can I customize a more detailed report?
Open the required report, click the Settings button, check the Advanced settings checkbox at the bottom, you will have additional bookmarks.
General tab
Use checkboxes to indicate which columns you need to see in the report and which not.
Use arrows to select the location of the columns.

Groupings Tab
On this tab, you can add/remove those columns/rows that you would like to see in the report, as well as transform the data for easy viewing.
Grouping rows - data will be generated downward, Grouping columns - data will be generated to the side (to the right). For example, in Row Grouping you can view sales data by item, and in Column Grouping you can see these sales by month.
You can add any field to fill in data in the report. Click the Add button, the Select Field window appears, where there are all the options that can be added to the report. We select the required option (with the plus sign you can reveal more information, for example, you need to look at the data in the context of the product article, then you click on the product and everything that relates to the product expands). Click OK to add a new field.

Row/column grouping type is an option for viewing data (grouping), for example Hierarchy, allows you to collapse/expand results.
3. How can I make a selection in a report based on a specific element of a directory/document/group of directories?
Tab Selection allows you to make a selection not only by those rows/columns that are already in the report settings, but also to add your own Selection option.
To do this, click the Add button and add the option you need from the Field Selection window. By ticking we make a choice for which element we will have a selection. Thanks to the Comparison Type column, we can select not only an individual element, but also groups.
Comparison type
Equals- select only one position
Not equal- one position for which you do not want to see data
On the list- the ability to create a list of positions that you want to see in the report. Through the List Selection window, create the required list of directory/document elements.
In a group from the list- you can select a list of individual groups/subgroups. In order to select exactly the group folder, you need to click the Select button, and so make a list of those subgroups for which you would like to see selection.

Not on the list - selecting a list of positions that should not be included in the report
Not in list group- selecting a list of groups/subgroups that should not be included in the report

In Group- you can select only ONE group (to select a group you must click the Select button)
Not in group- selection for one group that should not be included in the report.
4. How to create additional fields in separate columns?
Additional fields tab allows you to create additional fields in a separate column
- Add the required field
- Select Placement, in a separate column or in one column that is already in the report
- Select Position, before the Grouping column (that is, the first column), after the Grouping (second column), or instead of Ggrouping (that is, there will be no Grouping column at all).

5. How to sort a field in a report in ascending/descending order?
For example, we need to display product sales statistics; at the beginning of the report we will have the best-selling product.
Tab Sorting
Select the field that needs to be sorted - this will be the Quantity field (in base units), select the Descending sort option. And first we look at the best-selling product. If you need to look at a poorly selling product, then select sorting by Ascending.
6. How to remove zeros after the decimal point from a quantity in a report
Tab Design
Select the Quantity in basic units area in the column, open the Design column, check the box next to the Format field and open the value.
Next to the Length field, put a checkmark and select the maximum length of your number. If you need to set the fractional separator (that is, how many digits should be after the zeros), then check the box and select the number of decimal places. If you don't need fractional parts, then don't change anything.

We press the OK button, this setting goes to the Edit Design Settings window, we also click OK there, and now this format setting is included in the Design Tab.
We generate a report, and our quantity is now without a fractional part.

* Using the Design tab, you can select different design options. In another lesson we will provide options for setting up the report design.
7. Duplicate report settings for other users.
For example, we have managers who need to save the same Sales report in their settings. There are 7 of these managers, and the report settings are serious, and duplicating this seven times for each user is completely troublesome.
There is a way out!
- First, let's set up this report for one manager and save it.
- Then we go to the second manager’s database, open the Sales Report, click on the Restore settings button, this list is empty (since the second manager did not have saved settings).
- Click on the Settings all users button at the top, and now this list contains all the reports that were saved by users.
- Select the desired report, click Generate, and we have the report that we configured for the first manager
- Now we click the Save button and the settings of this report are saved for the second manager.

Today we told you just a few tricks for generating reports in 1C:Enterprise, of course these are not all the secrets, look for the rest in our next lessons.
We hope this lesson was useful to you! Thank you for your attention!
Best regards, company Fin Soft
You can learn this from us in the online courses “1C:Enterprise”, or enroll in our courses “1C:Enterprise”, which take place in our office.
If you have not purchased this program yet, you have an excellent opportunity to buy 1C:Enterprise 8. Trade Management for Ukraine on our website Below we have collected similar topics for you that will help you understand the functionality of the 1C:Enterprise program.
- < Назад
- Forward >
Secrets of setting up reports in 1C:Enterprise 8.3 - 4.5 out of 5 based on 6 reviews
We examined in some detail the settings of reports implemented on the basis of the access control system. Now let's look at more subtle and detailed settings for report options. The window for “advanced” settings of the report option is called by the command “More” - “Other” - “Change report option”.
The window for changing the report version is divided into two parts:
1. Report structure.
2. Report settings.

The report option structure section is similar to the “Structure” tab of the standard report settings. The purpose and configuration of groupings is discussed in detail in Part 1 of the article.
The report variant structure table, in addition to the actual column with groupings, contains several additional columns:
The report option settings section gives the user ample opportunities to configure the report to suit their needs. It almost completely coincides with the standard report settings discussed in Part 1. Let’s look at all the tabs of the section and note the differences.
The settings section consists of the following tabs:
1. Parameters. Contains ACS parameters available to the user.
The SKD parameter is a value used to obtain report data. This can be a condition value for selecting or checking data, as well as an auxiliary value.
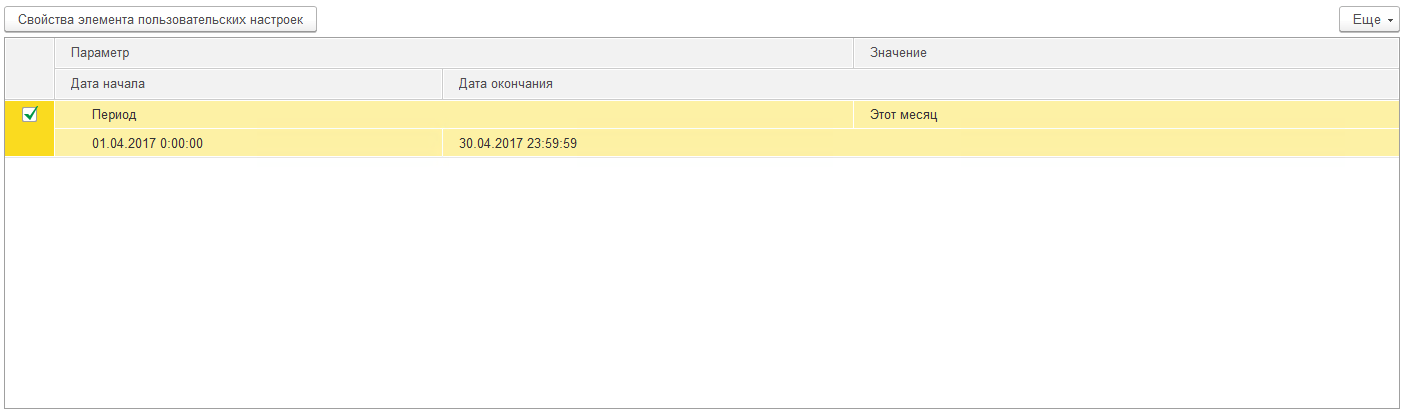
The parameter table is presented in the “Parameter” - “Value” format. If necessary, you can change the parameter values. Clicking the “Custom Settings Element Properties” button opens the custom settings of the element.

In this window, you can select whether the element will be included in the user settings (that is, visible to the user when setting up a report), set the element's presentation and editing mode (quick access in the report header, normal in the report settings, and inaccessible).
Custom settings item properties also have groupable fields, margins, selections, and conditional appearance elements.
2. Custom fields. Contains fields that are generated by the user himself based on the data selected by the report.

The user can add two types of fields:
- New selection field...
- New expression field...
Selection fields allow you to calculate a value based on a given condition. The selection field editing window contains a field title and a table in which the selection, value and presentation of the field are specified. Selection is a condition, depending on which the desired value will be substituted.

For example, let's calculate an estimate of the number of sales. We will assume that if less than 10 units of a product are sold, we sold a little, and if more than 10 units, we sold a lot. To do this, we will set 2 values for the calculated field: the first will be with the selection “Number of goods Less than or equal to “10””, the second with the selection “Number of goods Greater than “10””.
Expression fields allow you to calculate a value using arbitrary algorithms. They can use the functions of the query language and the built-in 1C programming language. The expression field editing window contains two fields for expressions of detailed and summary records. Total records are groupings configured in the “Report Structure” area; they must use aggregate functions (“Sum”, “Minimum”, “Maximum”, “Quantity”).

For example, let's calculate the average discount percentage. The average discount percentage is calculated using the formula: [Sales amount without discount] - [Sales amount with discount] / [Sales amount without discount]. It is important to remember that the sales amount without a discount may be zero, so we use the SELECT operator to check. We get the following expressions:
· For detailed entries:
Choice
When [Sales amount without discount] = 0
Then 0
Otherwise [Sales amount without discount] - [Sales amount with discount] / [Sales amount without discount]
End
· For summary records:
Choice
When Amount([Sales amount without discount]) = 0
Then 0
Otherwise Sum([Sales amount without discount]) - Sum([Sales amount with discount]) / Sum([Sales amount without discount])
End
As mentioned earlier, in the expression of total records we use the aggregate function “Sum”.
3. Groupable fields. Contains fields by which the results of the report variant will be grouped. Grouped fields are configured separately for each grouping, but you can set general grouped fields for a report option if you select the “Report” root in the structure tree. You can add a field from the report result, a custom field, or select an auto field, then the system will select the fields automatically. This tab also allows you to change the order of grouped fields.

4. Fields. Contains the fields that will be output as a result of the report variant. Fields are configured separately for each grouping, but you can set common fields for a report option if you select the root “Report” in the structure tree. You can add a field from the report result, a custom field, or select an auto field, then the system will select the fields automatically. This tab also allows you to change the order of the fields.
Fields can be grouped to logically highlight any part of the report or to specify a special arrangement of columns. When adding a group, the “Location” column becomes active and allows you to select one of the location options:
- Auto - the system places fields automatically;
- Horizontal - fields are positioned horizontally;
- Vertical - fields are arranged vertically;
- In a separate column - fields are located in different columns;
- Together - the fields are located in one column.

5. Selection. Contains selections used in the report variant. Setting up selections was discussed in detail in part 1 of this article. Filters are configured separately for each grouping, but you can set general filters for a report option if you select the root “Report” in the structure tree.

6. Sorting. Contains the sort fields used in the report variant. Setting up sort fields was discussed in detail in Part 1 of this article. Sorting is configured separately for each grouping, but you can set general sorting fields for a report option if you select the root “Report” in the structure tree.

7. Conditional registration. Contains conditional design elements used in the report variant. Setting up conditional appearance was discussed in detail in Part 1 of this article. Conditional appearance is configured separately for each grouping, but you can set general elements of conditional appearance for a report option if you select the root “Report” in the structure tree.

8. Additional settings. Contains additional report design settings. Allows you to select the general appearance of the report, the location of fields, groupings, details, resources, totals, set chart settings, control the display of the title, parameters and selection, determine the position of resources and fix the header and grouping columns of the report version.

In conclusion, I would like to note that report settings can not only be saved as a report option, but also uploaded to a file (menu “More” - “Save settings”). To download, you must select “Load settings” and select the saved file. Thus, we can transfer report variant settings between different databases that have the same configuration.

Based on this, we can summarize that the user can not only independently customize the report to suit his needs, but also save his settings and use them in the future if necessary.